
PIPONOMICS · ISSUE 04 · MONDAY, OCTOBER 12, 2026 · COT AS OF OCT 6
How quiet was the week? Quiet enough that the loudest thing in the majors was a shelf turning away its fifth test by nine pips. USD/JPY closed inside the 158 to 158.9 lid three times and never above it. GBP/USD closed at 1.3234, six pips under the week before, which makes eleven pips in two weeks. GBP/JPY tested the 210.3 to 210.7 shelf on Wednesday, the 28th anniversary of the 1998 Yen crash, reached 210.21, and went back to the range it has lived in since October 1.
And how busy was the crowd? On Tuesday October 6 the Big Guys sold another 11,306 Yen longs - 44,179 gone in three weeks, with the shorts barely moving - added 7,082 Loonie shorts for a third straight week of adding, flipped the Pound back to long after one week flat, sold 5,783 Aussie longs into a pair that had just closed under 0.70, and bought 22,075 Brazilian Real longs in a single report, which is a 59% bigger long book than the week before. In metals they sold 15,258 copper longs. .
01 THE LEDGER
What This Is: every level, date and idea from October 5, marked against what price did - misses and losses first, hits after, and anything pending or open at the bottom. A miss is a date or level that never got tested; a loss is one that got tested and failed. Weekly.
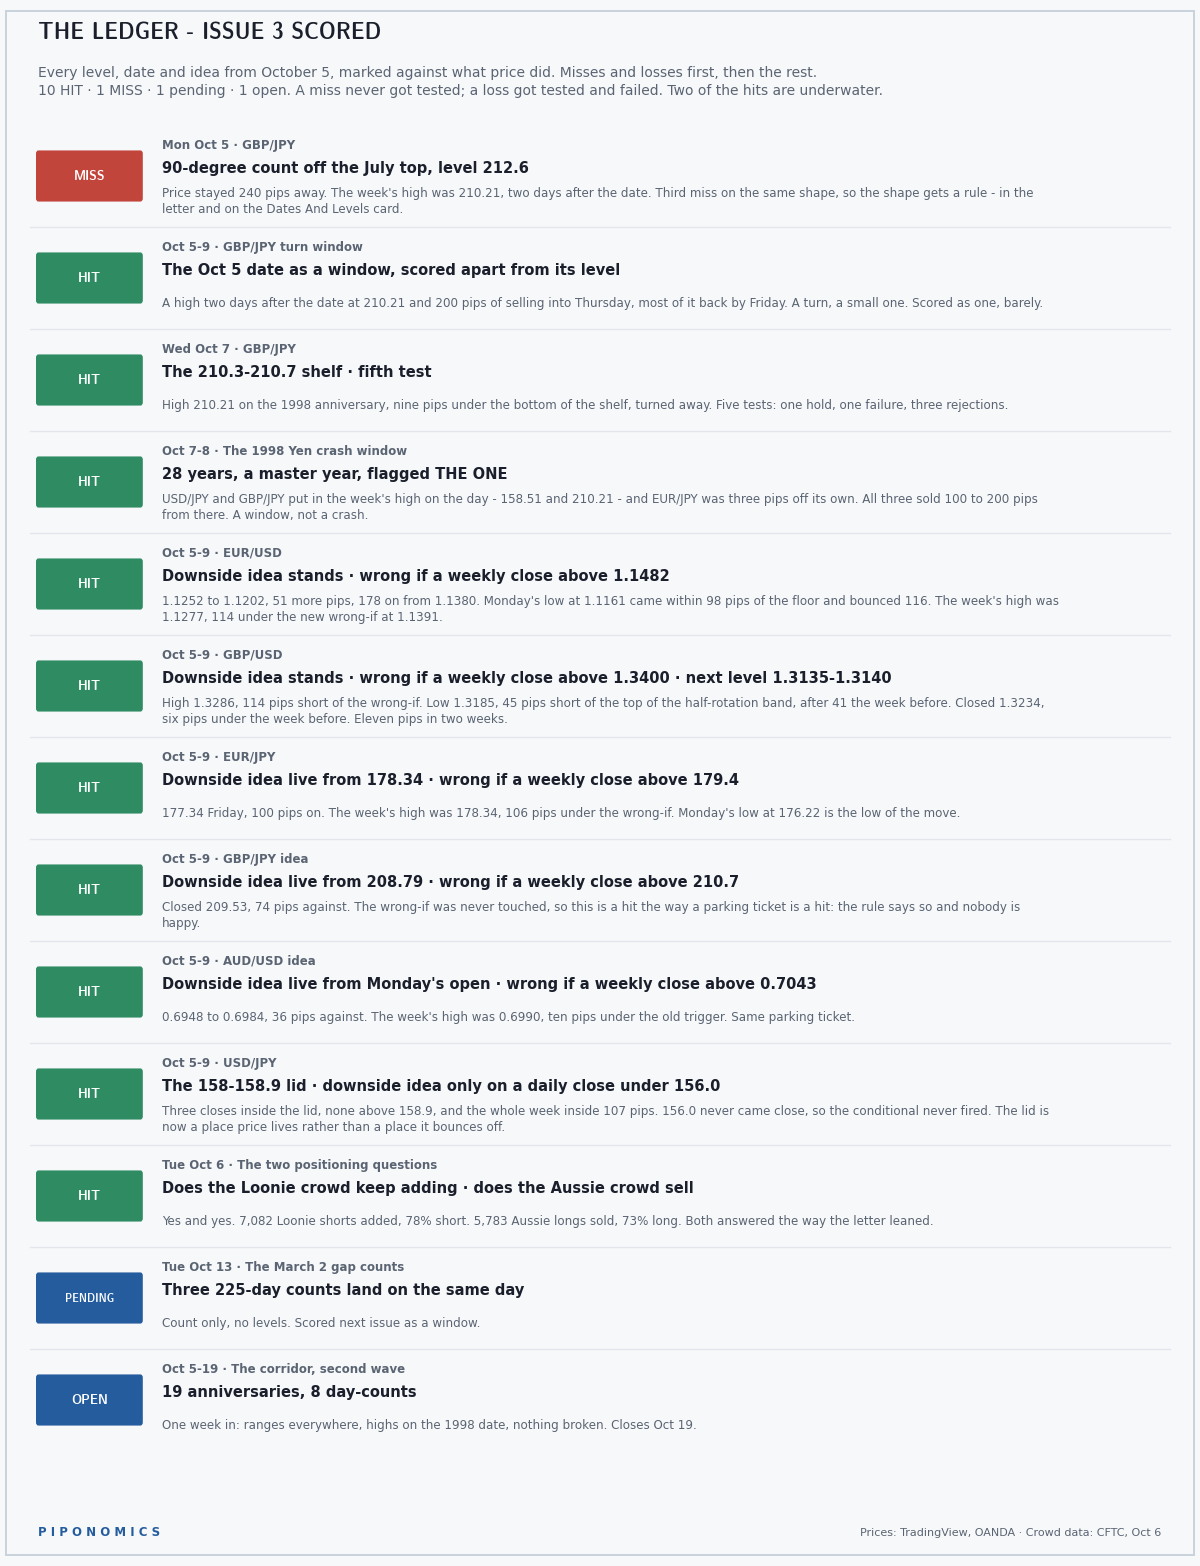
MISS - Monday October 5, GBP/JPY, the 90-degree count at 212.6. Price stayed 240 pips away. The week's high was 210.21, two days after the date, and it was the shelf that stopped it, not the count.
HIT - October 5 to 9, GBP/JPY as a turn window. A high two days after the date at 210.21 and 200 pips of selling into Thursday, most of it back by Friday.
HIT - Wednesday October 7, GBP/JPY, the shelf. High 210.21 on the 1998 anniversary, nine pips under the bottom of the 210.3 to 210.7 shelf, turned away. Five tests: one hold, one failure, three rejections. The Black Knight has lost two legs and is still blocking the bridge.
HIT - October 7 to 8, the 1998 Yen crash window, 28 years. It got the badge last week. USD/JPY and GBP/JPY put in the week's high on the day - 158.51 and 210.21 - and EUR/JPY was three pips off its own from the day before. All three sold 100 to 200 pips from there.
HIT - October 5 to 9, EUR/USD, downside idea stands. 1.1252 to 1.1202, 51 more pips, 178 on from where it was written at 1.1380. Monday's low at 1.1161 came within 98 pips of the floor and bounced 116. The week's high was 1.1277, 205 pips under last issue's wrong-if at 1.1482 and 114 under the new one.
HIT - October 5 to 9, GBP/USD, downside idea stands. High 1.3286, 114 pips short of the wrong-if. Low 1.3185, 45 pips short of the top of the half-rotation band at 1.3135 to 1.3140, after 41 pips short the week before. Closed 1.3234. Eleven pips in two weeks.
HIT - October 5 to 9, EUR/JPY, downside idea live from 178.34. Closed 177.34, 100 pips on. The week's high was 178.34, 106 pips under the wrong-if at 179.4. Monday's low at 176.22 is the low of the move so far.
HIT - October 5 to 9, GBP/JPY, downside idea live from 208.79. Closed 209.53, 74 pips against. The wrong-if at 210.7 was never touched, which makes this a hit the way a parking ticket is a hit: the rule says so and nobody is happy about it.
HIT - October 5 to 9, AUD/USD, downside idea live from Monday's open. 0.6948 to 0.6984, 36 pips against. The week's high was 0.6990, ten pips under the old trigger.
HIT - October 5 to 9, USD/JPY, the lid. Three closes inside 158 to 158.9, none above it, and a 107-pip week. The downside conditional at 156.0 never came close, so it never fired.
HIT - Tuesday October 6, the two positioning questions. Does the Loonie crowd keep adding? Yes, 7,082 shorts, 78% short. Does the Aussie crowd sell? Yes, 5,783 longs, 73% long. Both answered the way the letter leaned. Remember the Aussie answer, because price bounced 36 pips while the crowd was selling it.
PENDING - Tuesday October 13, the three March 2 gap counts. 225 days, count only, no levels. Scored next issue as a window.
OPEN - the corridor's second wave, October 5 to 19. One week in: ranges in every major, highs on the 1998 date, nothing broken. Closes next Monday.
02 THE PILE-UP
What This Is: who is crowded, and how badly. Weekly, from the CFTC Traders in Financial Futures report for currencies and the Disaggregated report for metals, futures only, October 6.
The Big Guys are the professional speculators - hedge funds and CTAs. A crowded position is a loaded spring.
Retail is the small-account money, on the row beneath. Asset managers are left off on purpose - they hedge, they don't chase.
Each bar is one group's own position, split long against short. Never one group netted against another. "Was" is the prior week.
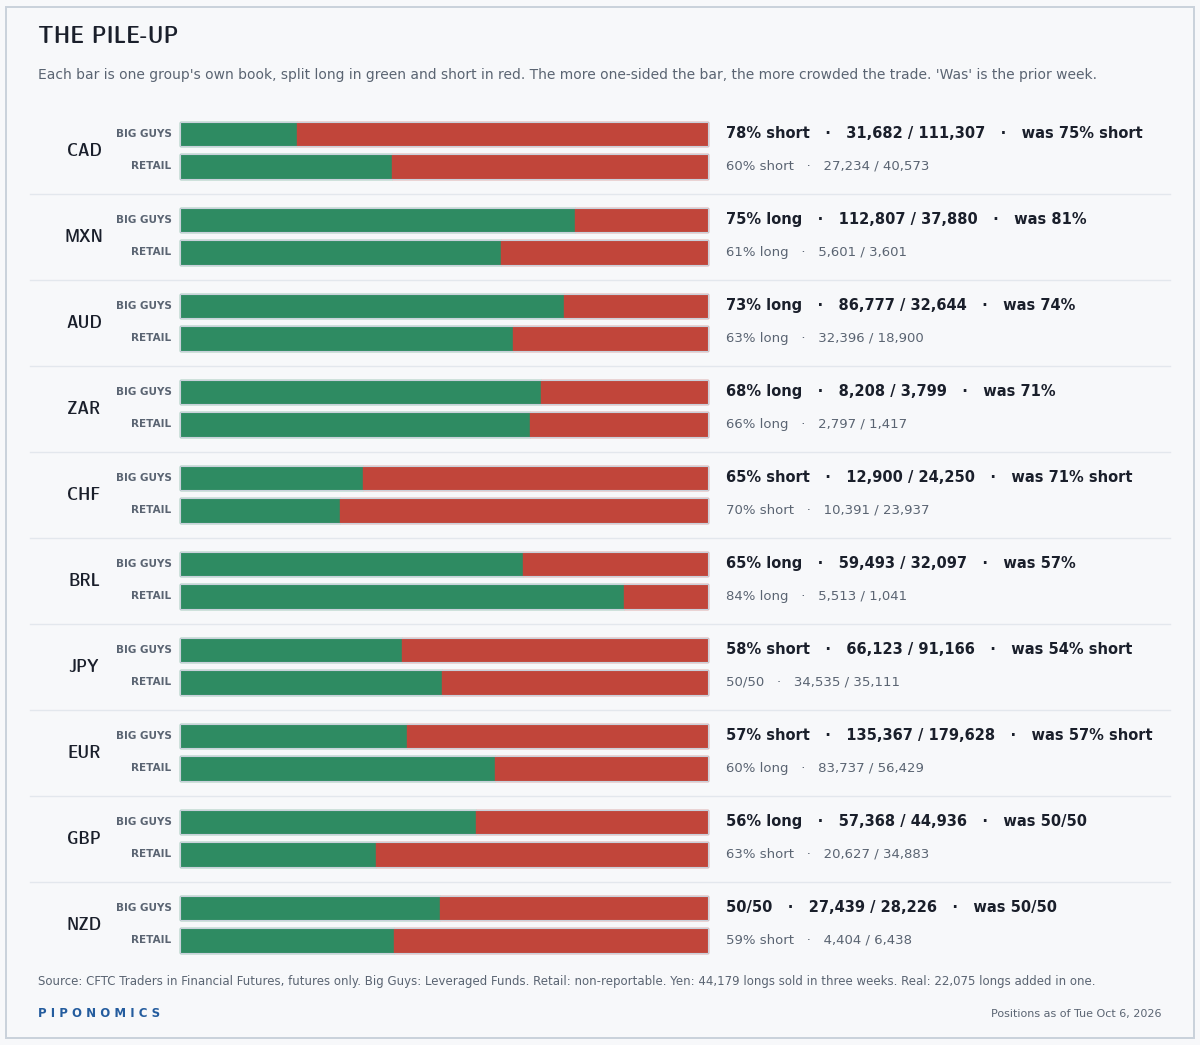
Loonie, 78% short - 7,082 shorts added, the third straight week of adding after 10,397 and 24,949. That is 42,428 Loonie shorts in three reports, and 111,307 in total, for a crowd that was covering as recently as September 15.
Yen, 58% short - and the shorts did not move. 11,306 more longs sold, 424 shorts covered. The Yen crowd has gone from 110,302 longs on September 15 to 66,123 on October 6, 44,179 contracts gone in three weeks, while the short side sat between 85,000 and 92,000 the whole time. This is not a crowd getting shorter by selling the Yen. It is a crowd getting shorter by quitting the Yen long.
Aussie, 73% long. 5,783 longs sold - the question from last week, answered - and price bounced 36 pips anyway, because the Big Guys selling 5,783 of 92,560 is not an unwind, it is a man leaving a stadium early to beat the traffic. There are 86,777 longs left in the seats.
Real, 65% long - 22,075 longs bought in one week, the largest add on the board, on a long book that was 37,418 the week before. The Real crowd arrived like the Rohirrim at dawn, horns and everything, and the Real crowd should be reminded how that charge went for the horses.
Peso, 75% long, from 85% three weeks ago. 12,956 shorts added, the first real short side the Peso has had since this letter started. What was the most crowded trade on the board three weeks ago is becoming less crowded by the other side showing up, which is the healthy way for that to happen, and the title has passed to the Loonie.
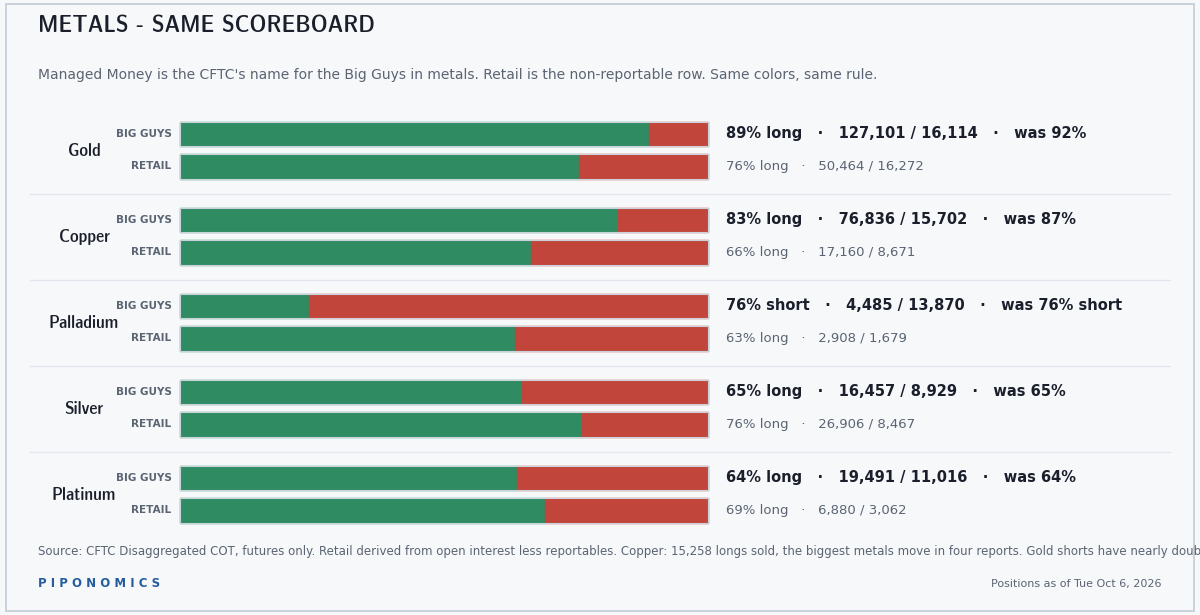
Copper, 83% long, from 87% - 15,258 longs sold, the biggest metals move in the four reports this letter has covered. Four reports ago they sold 14,303, then bought 12,717 back, then sold 4,327, then sold 15,258. The copper crowd is the Nostromo crew answering a distress call: fast, repeatedly, against advice.
03 THE APPOINTMENT BOOK
What This Is: when a market is most likely to turn. Three ways of measuring it, from the specific to the general - one pair's own cycles, then the whole calendar's anniversaries, then where the two agree. Updated as counts land, and one landed and missed.
One pair at a time. Counts run forward from a confirmation swing - the pivot that held and got retested. GBP/USD counts in calendar days. GBP/JPY counts in degrees of the year, where 360 is one year.
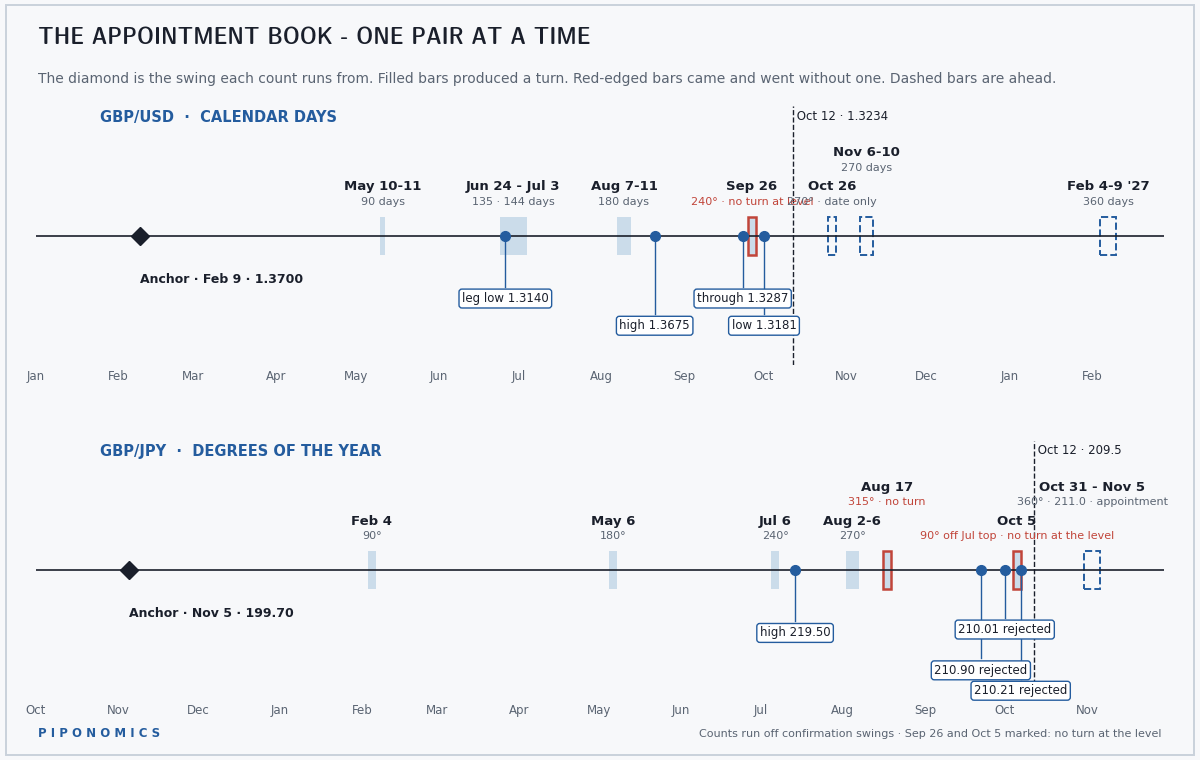
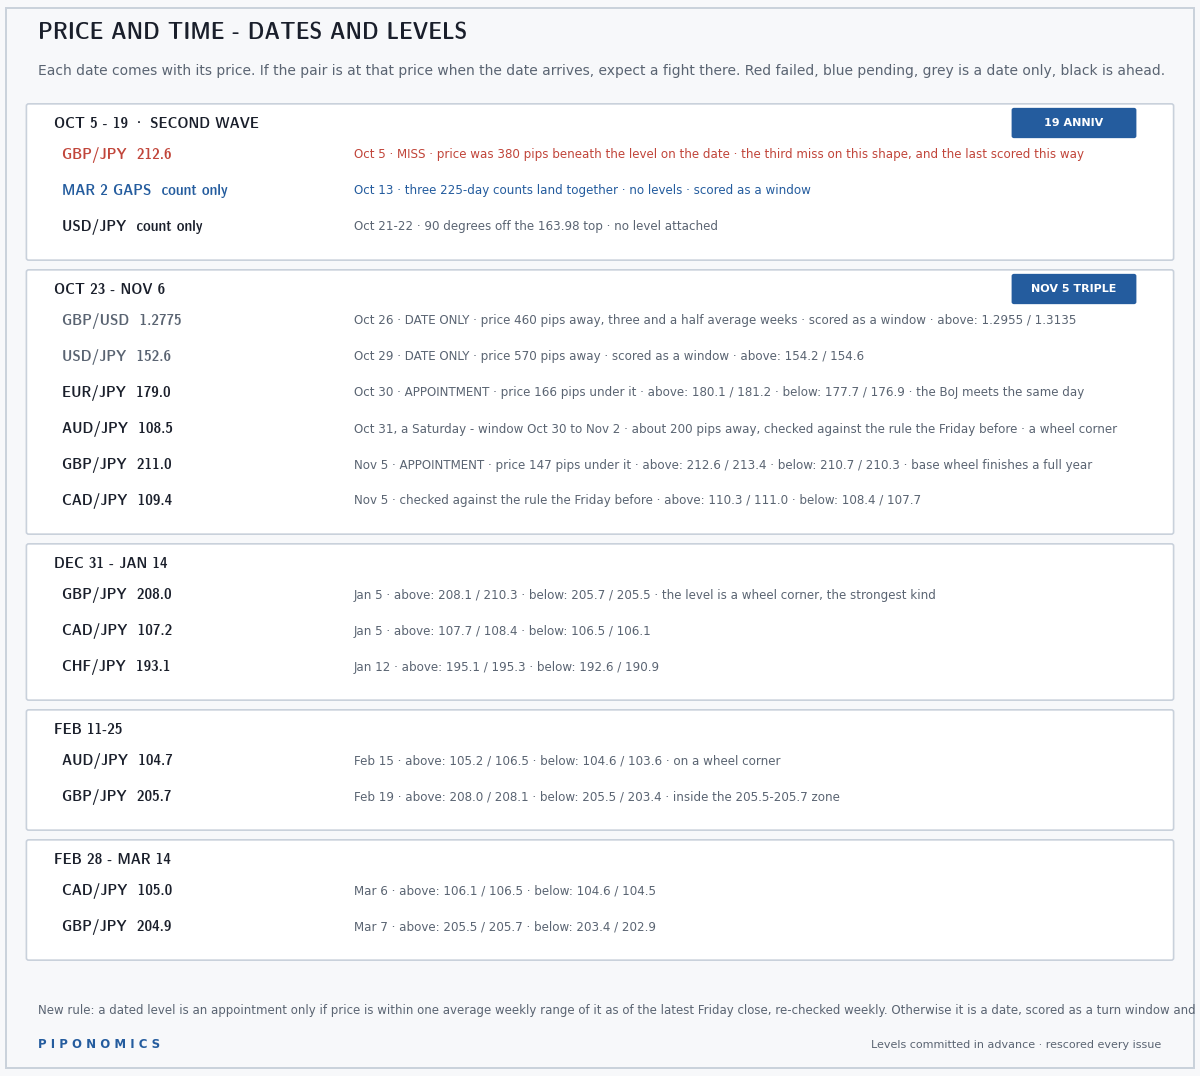
The next GBP/JPY count is coming up. The full year lands October 31 to November 5 with a level at 211.0, and price is 209.53 - 147 pips away, inside one average week.
GBP/USD's next: 270 days, November 6 to 10. The October 26 count at 1.2775 is 460 pips from price, three and a half average weeks, and is listed as a date only. USD/JPY's first committed count off the 163.98 top: 90 degrees, October 21 to 22, count only, no level, by design.
Scar Tissue - the whole calendar. The market has a memory. Crashes, spikes and record ranges leave a mark, and price has a habit of reacting again on their anniversaries - especially the round ones. Master years are squares, sevens and decades.
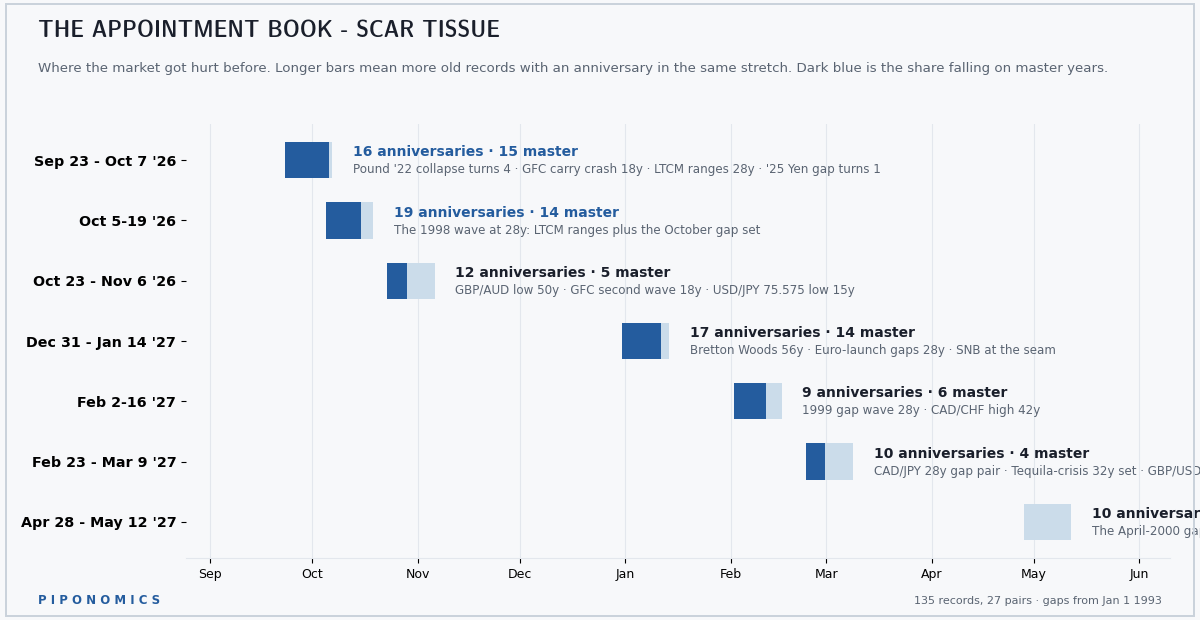
The 1998 Yen crash turned 28 on Wednesday (last week) and the Yen pairs put in their highs for the week on the day. 100 to 200 pips of selling followed, and then Friday bought a good part of it back. On the scale of 1998 that is not an event. On the scale of a calendar that said watch Wednesday, it is Wednesday doing what it was asked.
Next: the October 23 to November 6 block, with the triple that closes on November 5 at the end of it - GBP/JPY's full year, CAD/JPY's count, and the 15th anniversary of USD/JPY's post-war low from October 31, 2011, which is 75.575 on the feed this letter uses and 75.31 on most others. The Fed meets on the 27th and 28th and the Bank of Japan on the 29th and 30th, inside the block - both hiked in September.
Where the two agree. This year's own day-counts run off 36 committed swing dates. When they pile up in the same days as the old anniversaries, two separate systems picked the same stretch without consulting each other.
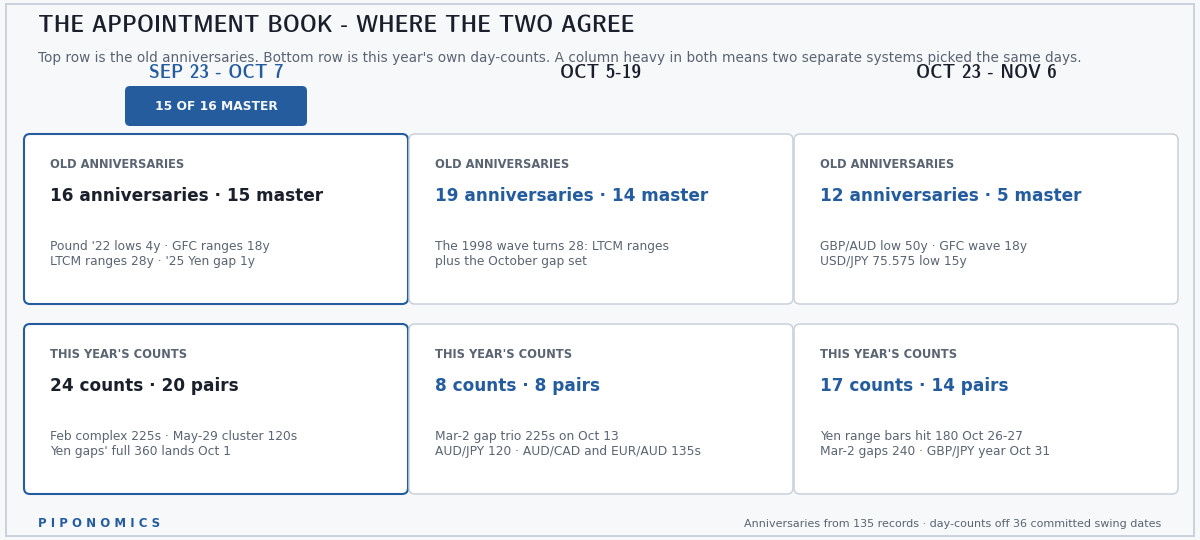
The second wave, one week in, has been ranges. Five breaks in the first three sessions of the first wave, the Yen gap count on October 1, the 1998 highs on October 7, and otherwise a market that moved less each week. Two calendars agreeing is a reason to expect the stretch to be interesting.
Tuesday October 13: the three March 2 gap counts land together at 225 days. No levels, by rule. Monday October 19: the corridor closes. What comes after it is the October 23 to November 6 block, which carries two central bank meetings and the triple, neither of which the corridor had.
04 PRICE AND TIME
What This Is: Gann's wheels turn a major price into a set of levels and a set of dates. Run a major top through the Square of Nine - plus the Hexagon chart on Yen pairs - and it produces levels where declines tend to pause and dates when turns tend to happen. Updated as levels are tested, and this week they were respected from a distance.
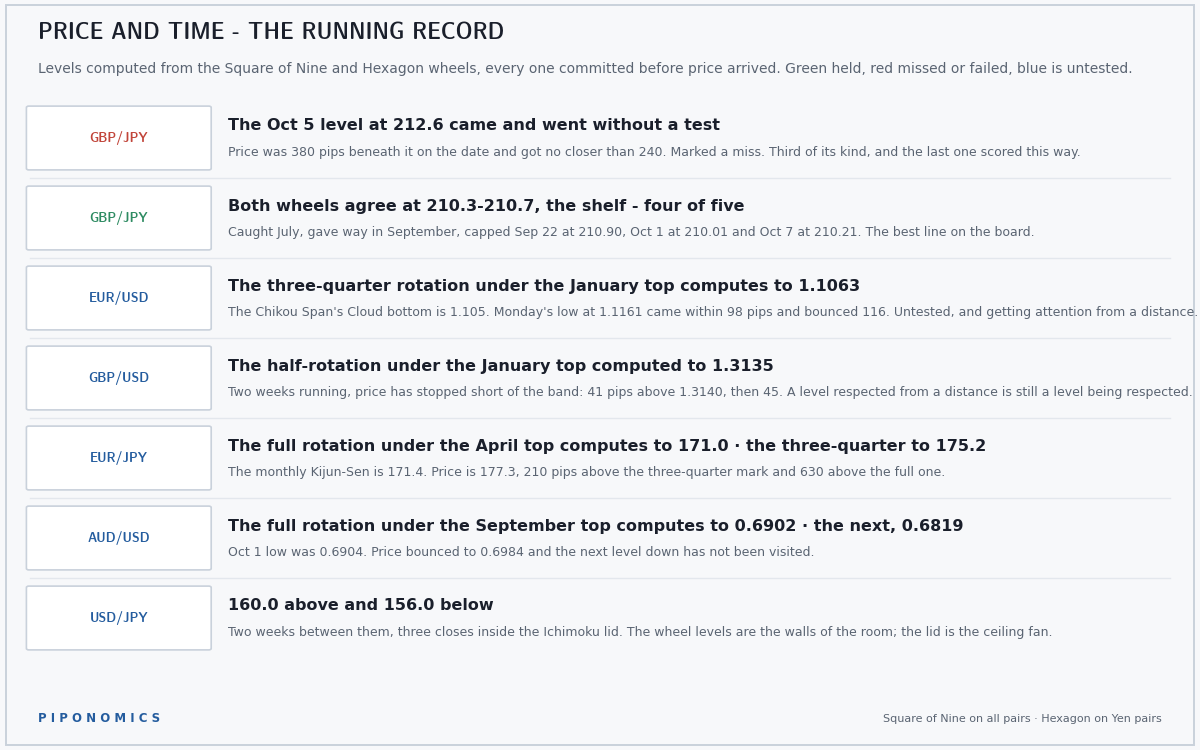
GBP/JPY's October 5 level is marked failed, the third of its kind and the last one that will be scored this way. The shelf is four of five. Caught July, gave way in September, capped September 22 at 210.90, October 1 at 210.01 and October 7 at 210.21. It is the best line on the board and it has earned the right to be called that.
EUR/USD's floor at 1.1063 and 1.105 is 98 pips from Monday's low and untested. Price got within one average week of it and bounced 116 pips, which is what a level does when it is being noticed from a distance rather than tested.
GBP/USD's 1.3135 to 1.3140 has now stopped price short two weeks running. Thursday's low 1.3185, 45 pips above the top of the band; the week before, 1.3181, 41 pips above it.
EUR/JPY: the three-quarter rotation under the April top is 175.2, the full rotation 171.0, the monthly Kijun-Sen 171.4. Price is 177.3, 210 pips above the first and 630 above the second. Monday's low at 176.22 is the move's low and the next number under it is 175.2.
AUD/USD: 0.6902 held within two pips on October 1 and the next rotation down, 0.6819, is committed.
05 MONEY WHERE THE MOUTH IS
What This Is: the charts worth an opinion this month, and what the opinion is. Every idea carries the level that proves it wrong. Charts are OANDA data via TradingView - dailies, weeklies and the October monthly bars, all through Friday's close.
EUR/USD - downside idea stands, 178 pips on, past halfway to the floor.
The weekly closed at 1.1202, a third week under the Cloud, each lower than the last.
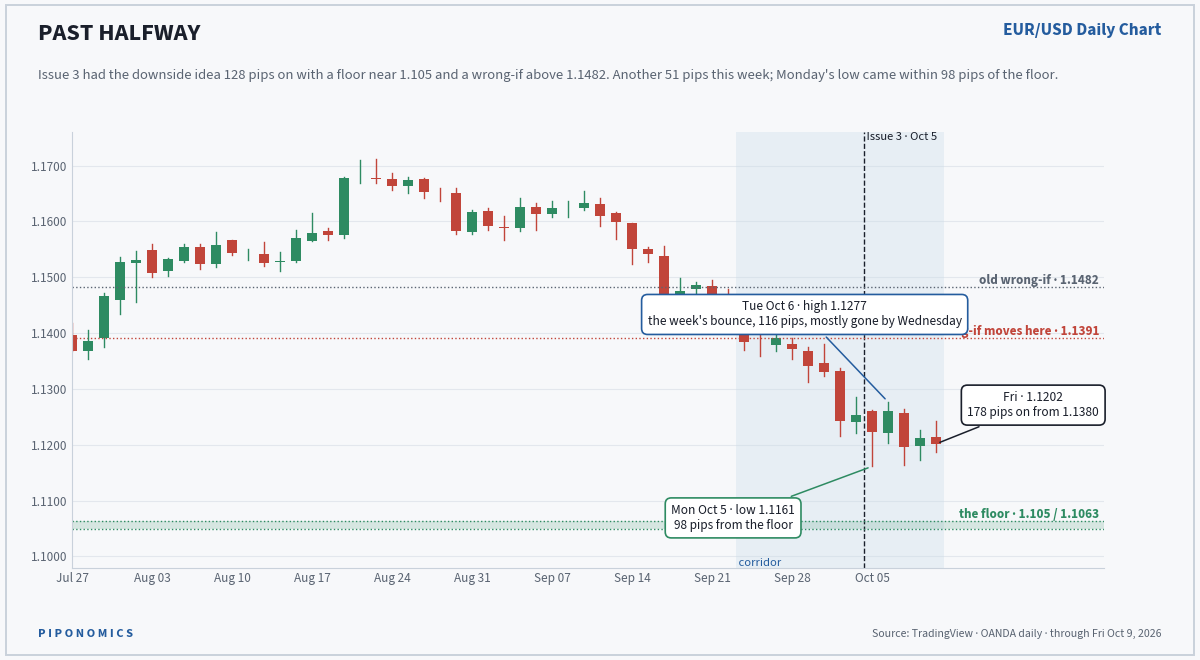
Monday's low at 1.1161 came within 98 pips of the floor and bounced 116 to Tuesday's 1.1277, and the bounce was mostly gone by Wednesday's close at 1.1196. That is a level being noticed from one average week away. It is not a level being tested.
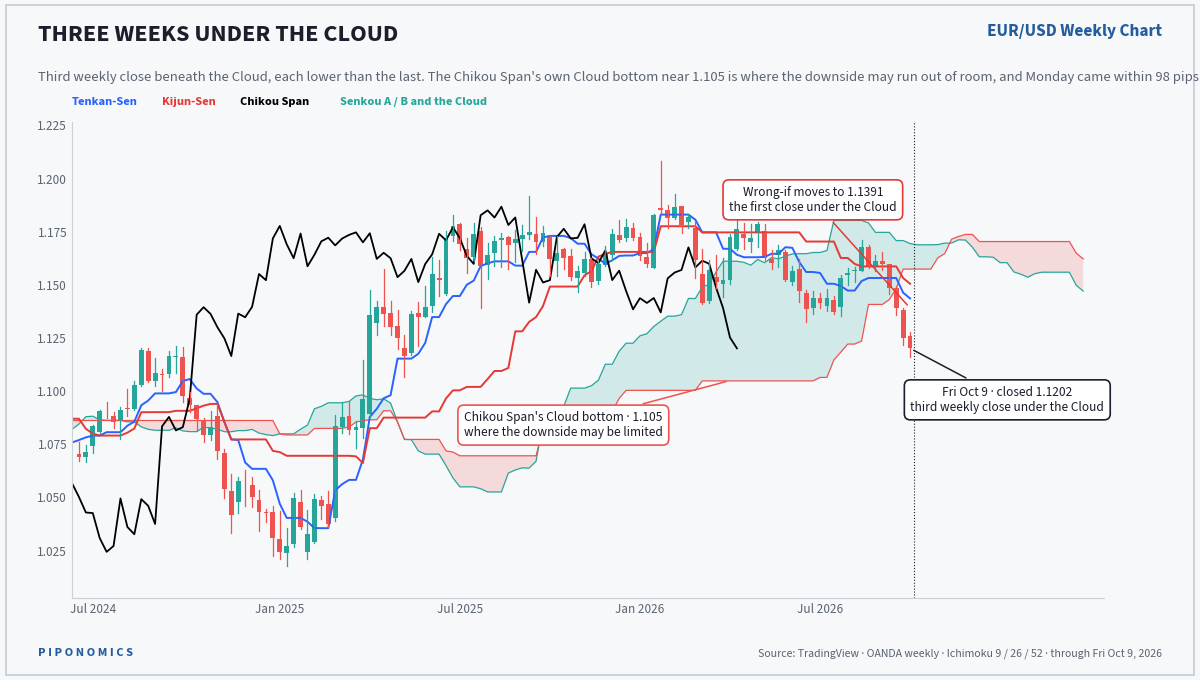
Three weekly closes under the Cloud, the Tenkan-Sen and Kijun-Sen rolling over above price, the Chikou Span under the candles it is plotted against. The breakout has done nothing wrong. The floor is the only thing in the way, and it has two signatures on it: the Chikou Span's Cloud bottom at 1.105 and the three-quarter rotation at 1.1063.
Bears get giddy under 1.1161. Bulls get a look at the floor and not before it. Between 1.1161 and 1.1063 this is a downside idea walking toward the place it said it would reassess.
Wrong if the weekly close is back above 1.1391 - the first close under the Cloud, and the level this idea moves its wrong-if to after two weeks and 178 pips. Not where it was written. A level.
GBP/USD - downside idea stands, after two weeks of nothing.
Closed 1.3234. Eleven pips in two weeks.
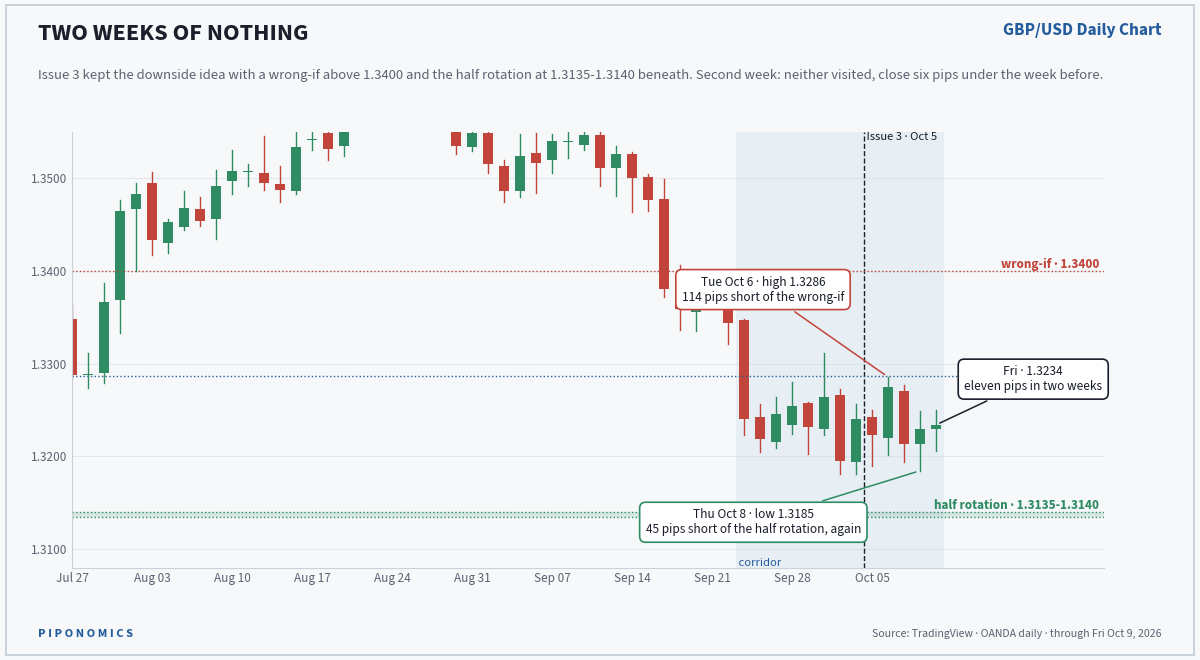
The wrong-if at 1.3400 was 114 pips away at the worst moment. The half-rotation band at 1.3135 to 1.3140 was 45 pips away at the best one, after 41 the week before. Groundhog Day, except Bill Murray learned the piano and GBP/USD learned nothing.
The Pound crowd flipped back to 56% long, which is three positions in three reports and removes the crowd as a reason to be on either side. The level is the reason, and the level has been respected from 41 and 45 pips. Bears get interested under 1.3181, the two-week low. Wrong if the weekly close is back above 1.3400. Unchanged.
GBP/JPY - downside idea, live from 208.79, 74 pips against.
The shelf held a fifth test. The idea underneath it did not go anywhere.
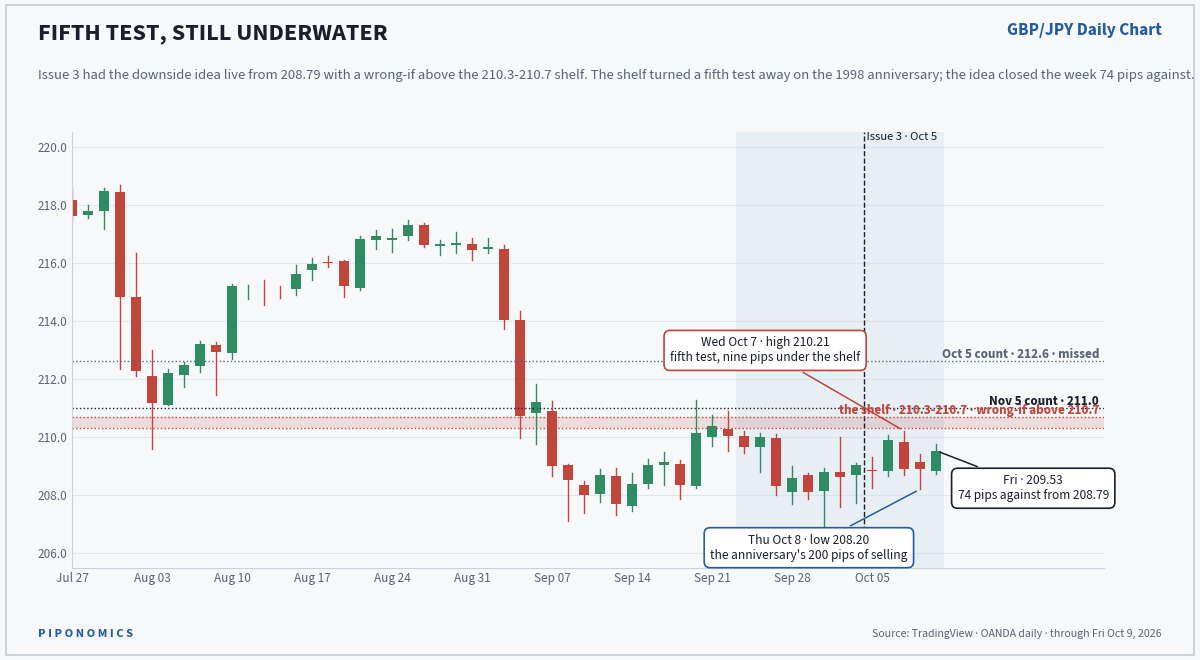
Wednesday's high at 210.21 on the 1998 date was the fifth test of 210.3 to 210.7 and the third rejection. Nine pips under the bottom of the shelf. Thursday sold 200 pips to 208.20, Friday bought most of it back, and the pair closed the week 74 pips above where the idea was written.
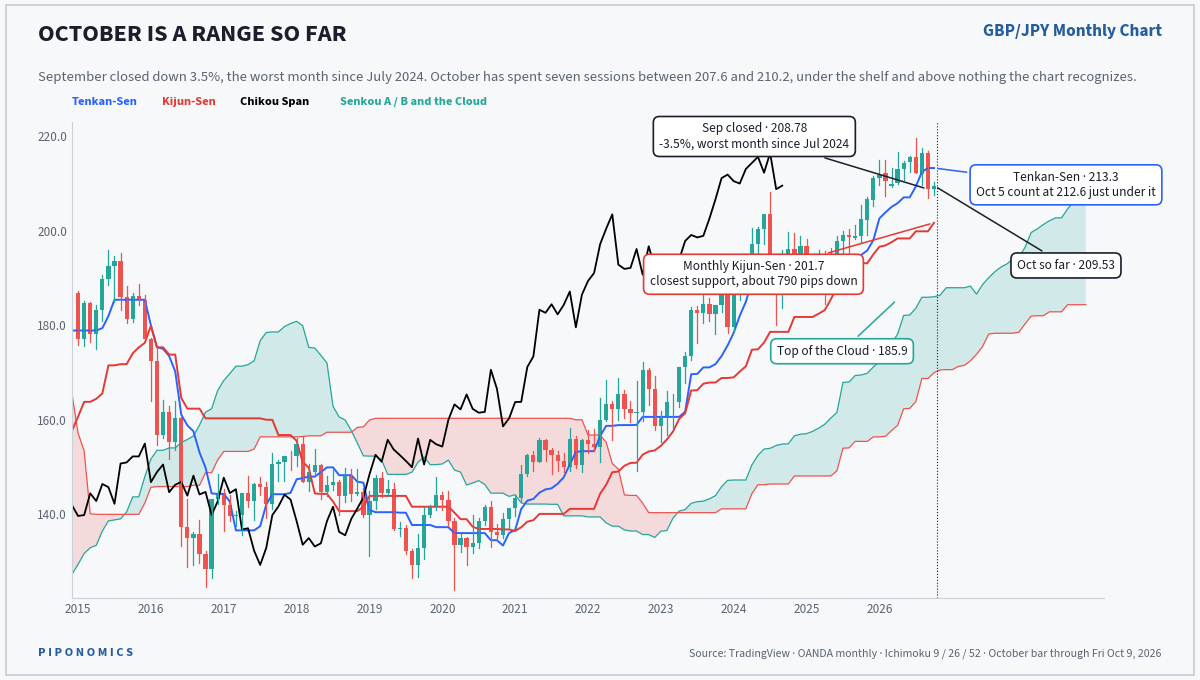
October has spent seven sessions between 207.6 and 210.2, under the shelf and above nothing the monthly chart recognizes until the Kijun-Sen at 201.7. The monthly Detrended Price Oscillator closed September under zero and the Composite Index is at the near-term support zone from 2018. Neither has been contradicted by a range.
The problem for the idea is not the chart. It is the calendar. The November 5 appointment at 211.0 is 147 pips above price, with the shelf between, and an appointment above a downside idea is a date with a bounce. Bears get nervous above 210.2 and are wrong on a weekly close above 210.7. Bulls are not interested in anything under a weekly close above 211.0.
Wrong if a weekly close is back above 210.7. The shelf has to fail for the idea to fail. Five tests say the shelf does not fail easily; 74 pips underwater says the idea has not been right yet.
EUR/JPY - downside idea, live from 178.34, 100 pips on, in a range.
Closed 177.34. The week was 176.2 to 178.3, and the move's low at 176.22 came on Monday.
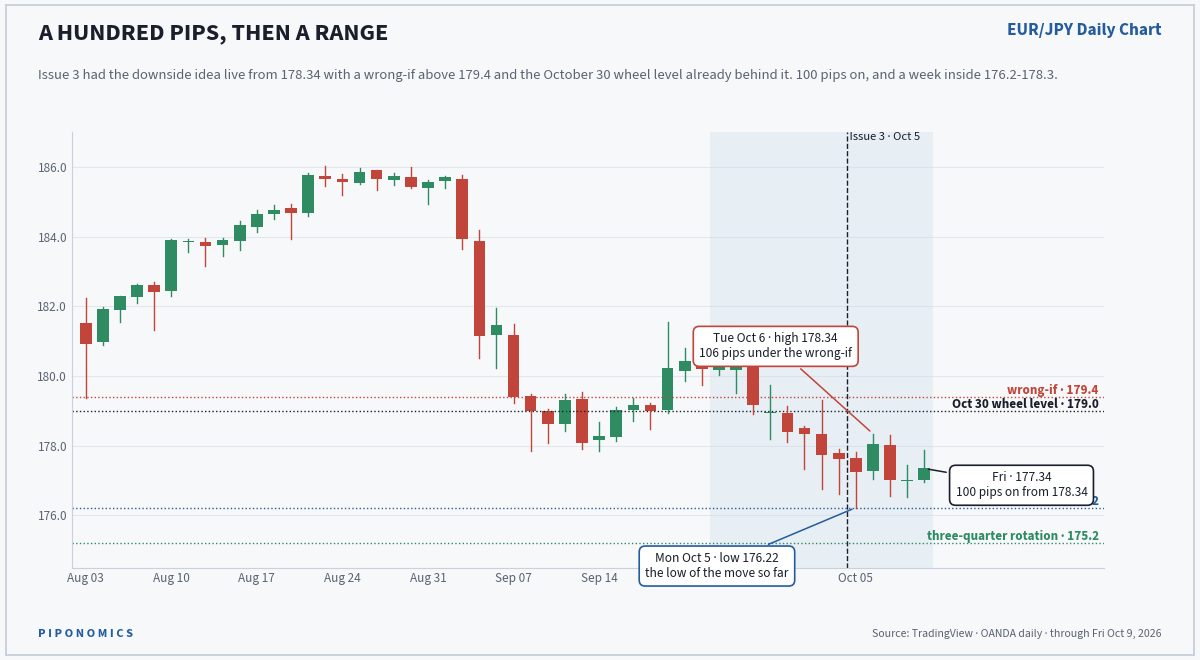
Tuesday's high at 178.34, the day after the low, was the week's whole bounce, 212 pips from Monday's low, and it was gone by Wednesday's close at 177.00. The wrong-if at 179.4 was never within 100 pips.
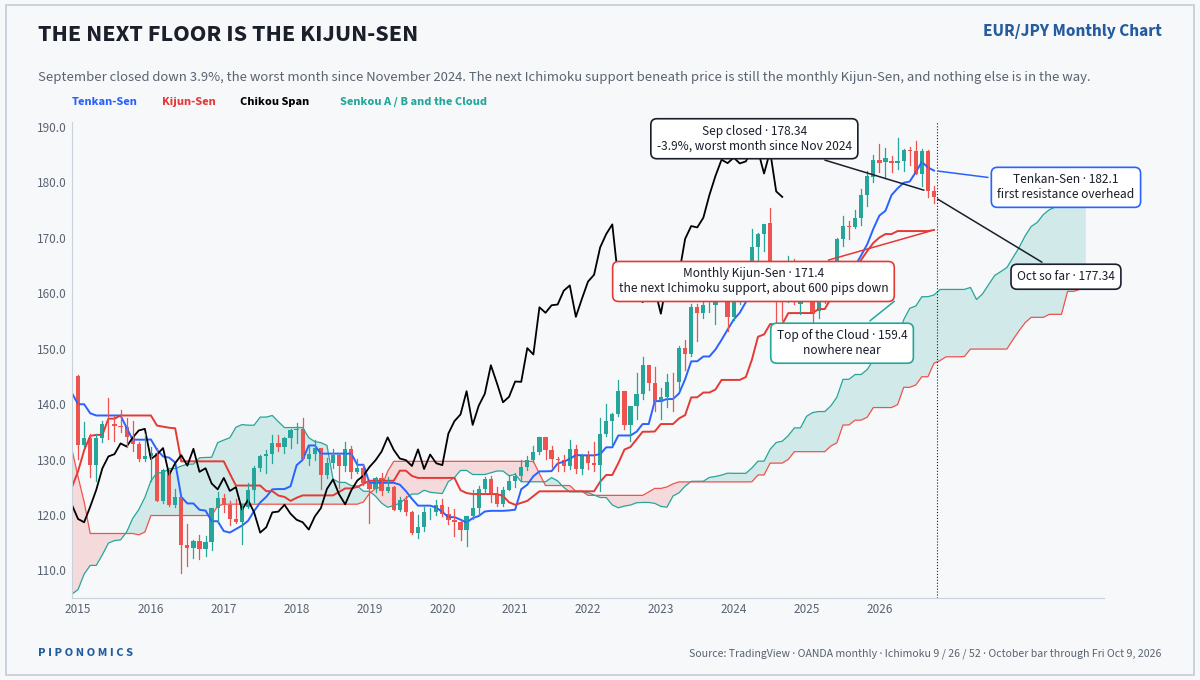
September closed down 3.9%, the worst month since November 2024. October so far is a 310-pip range around that close, with the high on October 1. The monthly DPO is under zero and the Composite Index is approaching its historical support zone, which could be a floor or could be a warning that the drive south is likely - the DPO says warning.
Bears get giddy under 176.22. The next wheel level is the three-quarter rotation at 175.2, 100 pips under the low, and then nothing until 171.0 and the Kijun-Sen at 171.4. Bulls have an appointment on October 30 at 179.0 and not much else.
Wrong if a weekly close is back above 179.4 - the half rotation under the April top, eight pips above Thursday October 1's high at 179.32. Unchanged.
AUD/USD - downside idea, live from 0.6948, 36 pips against.
The crowd sold 5,783 longs. Price bounced to 0.6984 anyway.
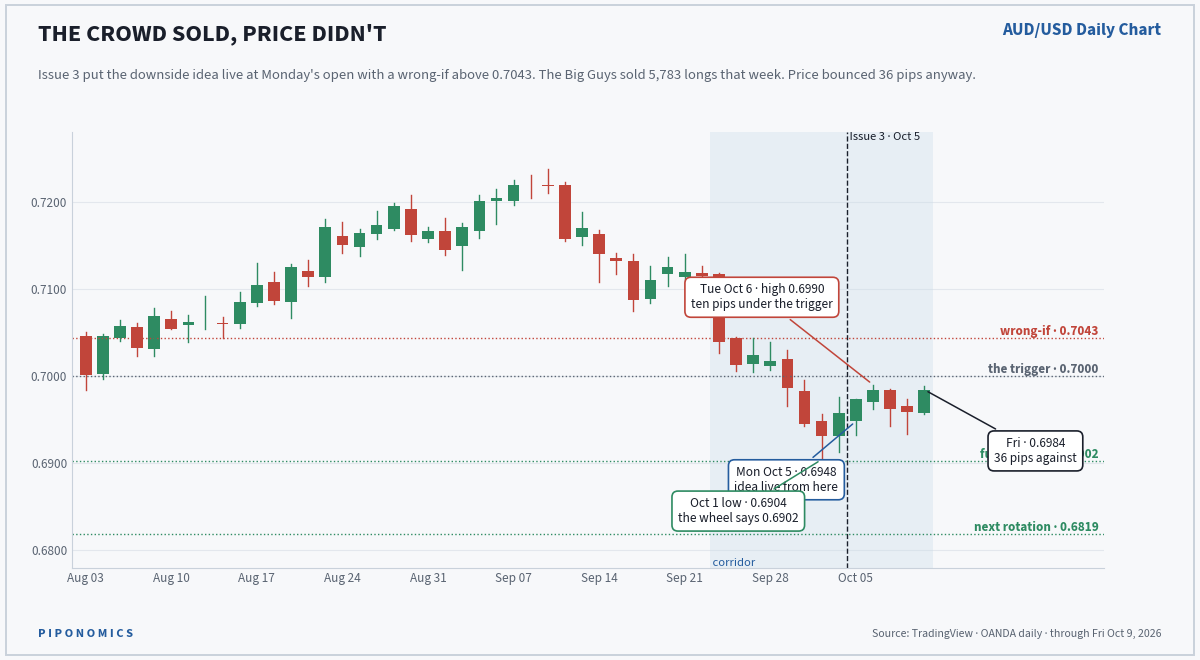
Tuesday's high at 0.6990 was ten pips under the old trigger at 0.7000 and the pair spent the rest of the week between 0.6933 and 0.6989. The full rotation at 0.6902 held within two pips on October 1 and has not been revisited.
The idea exists because the crowd is 73% long and only just started leaving. 5,783 of 92,560 is not an unwind. Bears get interested under 0.6933 and giddy under 0.6902; bulls are watching 0.7000 and will say so loudly if it closes above it. Wrong if the weekly close is back above 0.7043, the September 25 high. Unchanged.
USD/JPY - nothing yet, and the lid has become an address.
158.31, three closes inside 158 to 158.9 in five sessions, a 107-pip week, and the Yen crowd 58% short the Yen with 44,179 longs gone in three weeks.
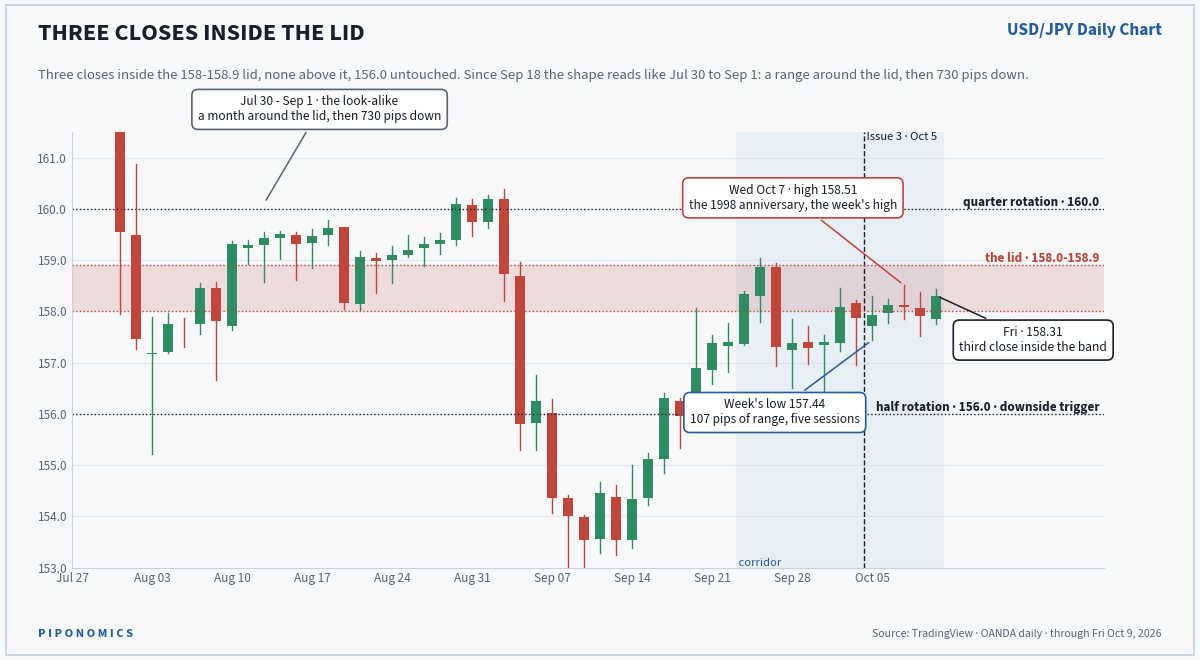
Two weeks ago the lid was where bounces went to die. This week price moved in. USD/JPY has settled into the lid the way the Weasleys settled into the Burrow: it looks temporary, and it is not. A level that price lives inside is not resistance anymore; it is a floor being built from above.
The crowd is the complication. 58% short the Yen is a crowd leaning on USD/JPY going up, and a crowd that one-sided does not get a topside idea from this letter on a close above 158.9. It gets a note that the lid moved.
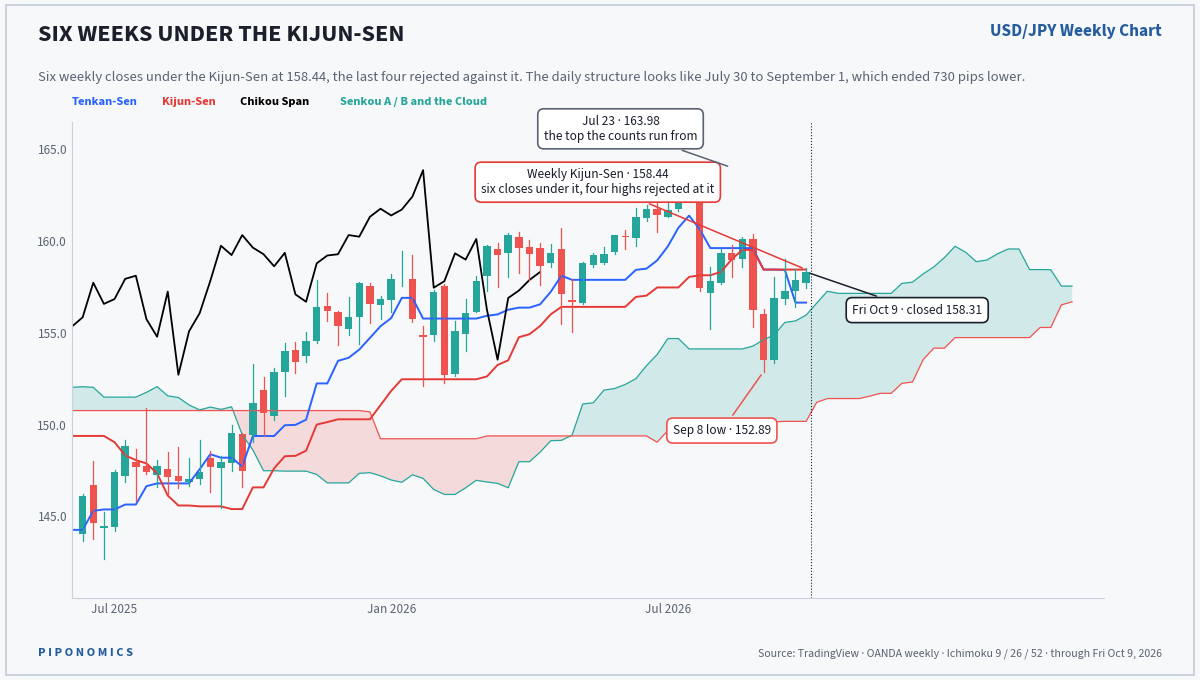
The weekly is the other complication. Six weekly candles have now closed under the weekly Kijun-Sen at 158.44, and the last four have been rejected against it - their highs are 158.06, 159.04, 158.46 and 158.51, and the closes are all underneath. The lid on the daily and the Kijun-Sen on the weekly are the same ceiling measured twice.
And the daily candlestick structure since September 18 looks like July 30 to September 1: a month of ranging around the lid after the drop from 163.98, with the crowd leaning the wrong way, followed by 730 pips down to 152.89. Nobody is promising a rerun. The letter is noting that the last time this shape showed up it did not resolve upward.
The downside conditional stands: a daily close under 156.0 with that crowd in place is the idea. Bulls are comfortable above 158.0 and would get a real argument from a weekly close above 158.44, the first since the week of August 24. Bears are not interested until 157.4, the week's low, gives way, and get giddy under 156.0.
NZD/JPY - watched, not an idea, and no longer nothing.
88.87. September closed down 6.2%, the worst month since July 2024, and the week of September 28 closed beneath the weekly Cloud.
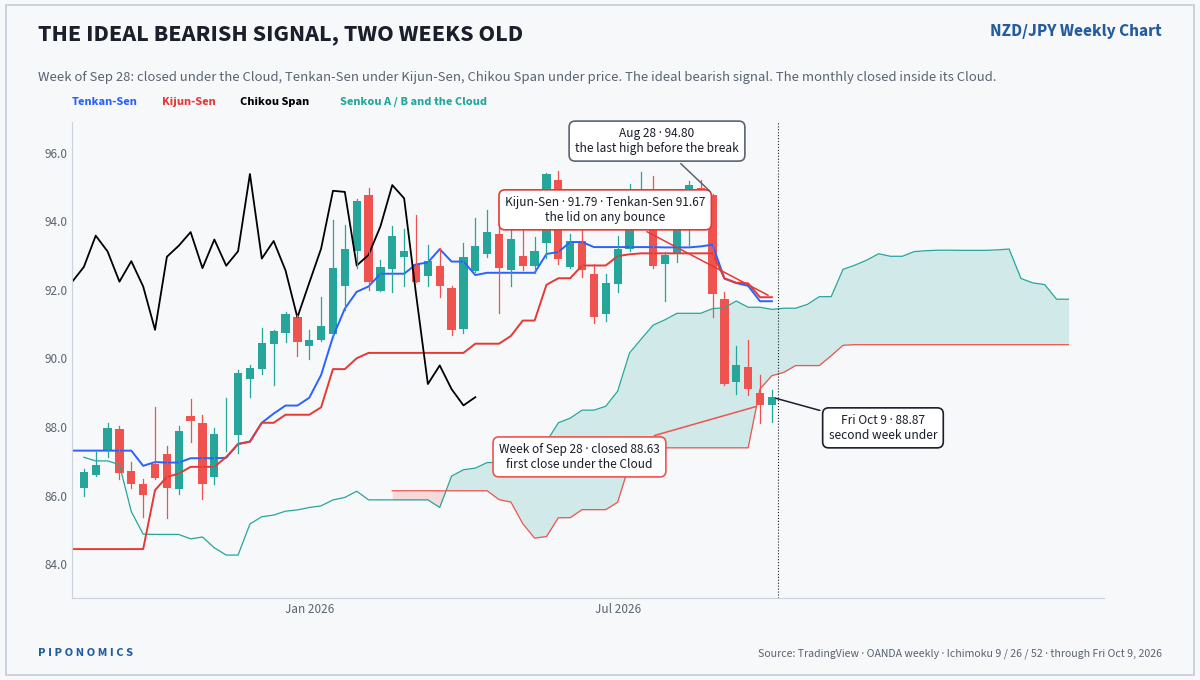
That September 28 close was the ideal bearish Ichimoku signal on the weekly: price under the Cloud, the Tenkan-Sen under the Kijun-Sen, the Chikou Span under the candles it is plotted against. Two weeks under the Cloud since, and the Tenkan-Sen at 91.67 and Kijun-Sen at 91.79 are the lid on any bounce.
The monthly closed September inside its own Cloud, and inside the Cloud is the no-trade zone. The weekly says downside; the monthly says not yet; the higher timeframe wins the argument in this letter. Bears get giddy on a weekly close under 88.12, the October 1 low and the low of the break. Bulls need a weekly close back above the Kijun-Sen at 91.8 and are not getting one from a 92-pip week.
NZD/USD - watched, and the reason to be careful with every dollar idea above.
0.5612. Seven weekly candles down from the August 21 swing high at 0.5988, and Friday was day 49.
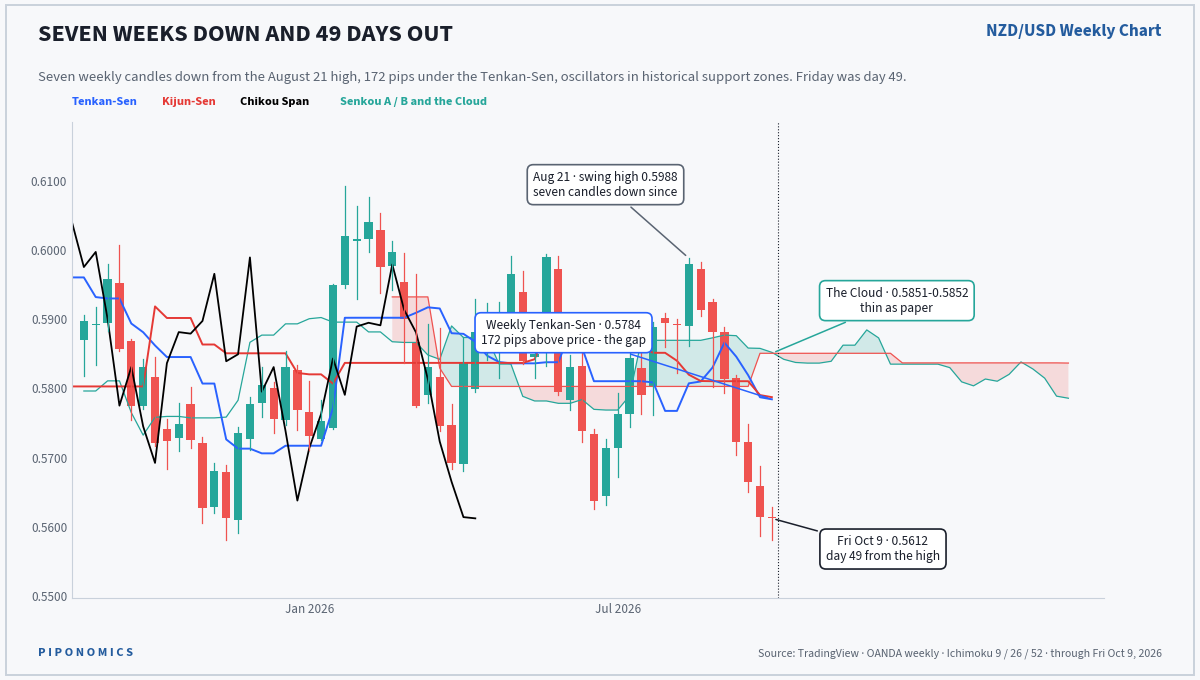
The weekly Composite Index and the weekly Detrended Price Oscillator are both in historical support zones, and there is a massive gap between the candlestick bodies and the weekly Tenkan-Sen - 172 pips, or 3%, the widest on the dollar board.
Gann's 49-day death zone is the window seven weeks out from a swing - seven times seven - where trends tend to exhaust. Seven to eight weekly candles down from the prior swing high is where it plays out, and Friday was the seventh. Bears should be nervous here and bulls will be looking for a bounce back toward the Tenkan-Sen at 0.5784. That is not a topside idea. It is a reason the dollar ideas in this letter stop being pressed this week and start being defended.
The weekly stretch - every dollar pair at once.
NZD/USD is the loudest version of something that is on most of the dollar board.
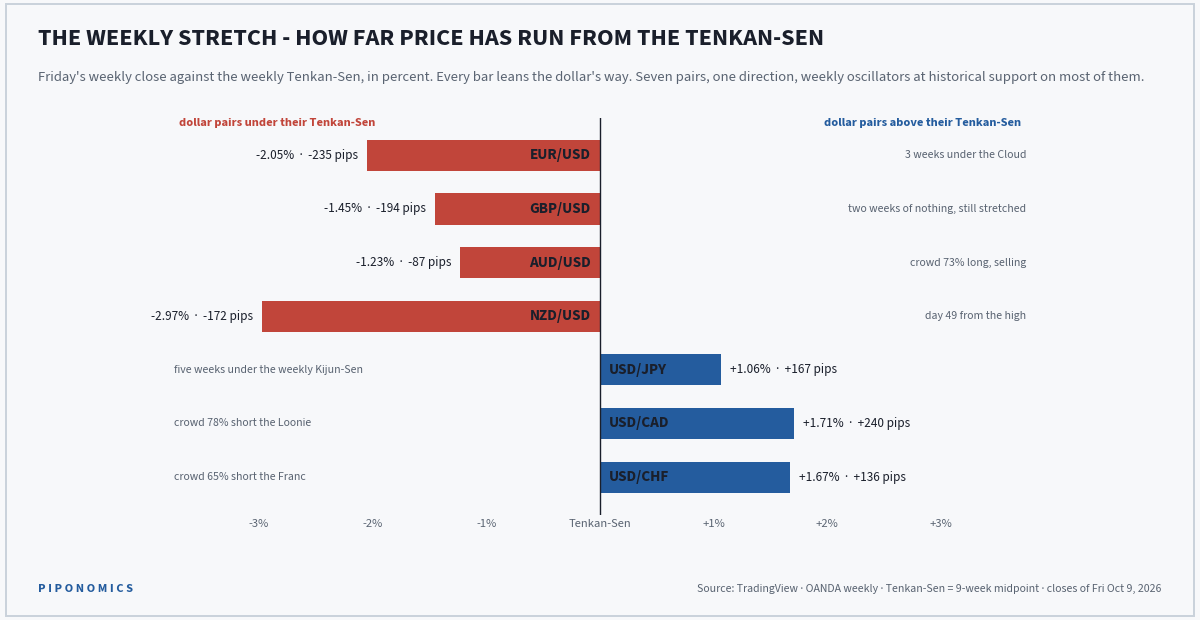
EUR/USD, GBP/USD, AUD/USD and NZD/USD closed Friday 1.2% to 3% under their weekly Tenkan-Sen. USD/JPY, USD/CAD and USD/CHF closed 1% to 1.7% above theirs. Seven pairs, one direction, and the weekly Composite Index and Detrended Price Oscillator sitting in historical support zones on most of the dollar pairs at the same time.
A gap like that between the candles and the Tenkan-Sen closes one of two ways: price comes back to the line, or the line catches up to price while price waits. Either way the next few weeks are more likely to be about the gap closing than widening. And how did the Big Guys position for that? Three straight weeks of leaning on the dollar side - a net 65,000 contracts against the Euro, Loonie, Yen and Pound two reports ago and another 18,000 this one. The crowd is leaning on a door at the exact moment the weekly charts say the door is about to be opened from the other side.
Nothing above changes its wrong-if because of this. What changes is the posture: EUR/USD's floor at 1.105 gets respected rather than argued with, GBP/USD's 1.3135 is a place to expect a fight rather than a pass, and the two underwater Yen-cross ideas do not get more room.
Metals - two charts worth an opinion, and the same opinion twice.
Platinum and silver are shaped the same on the daily, and neither has done the one thing that would make them an idea.
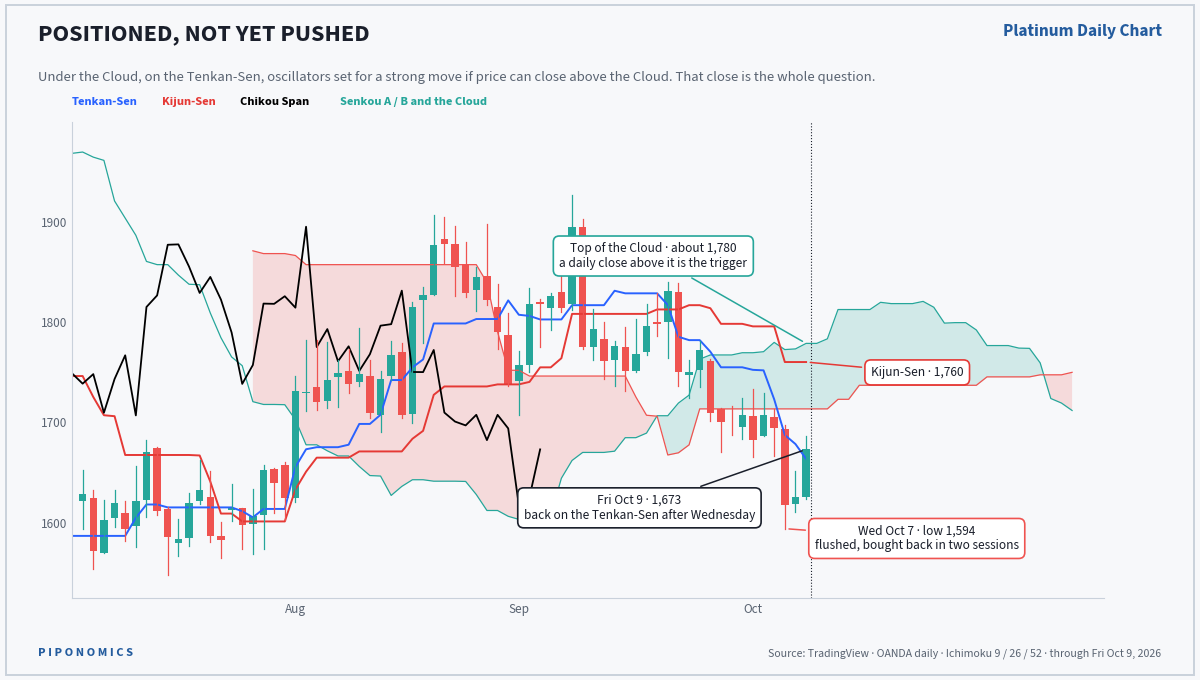
Platinum closed Friday at 1,673, under the Cloud and back on the Tenkan-Sen at 1,663 after Wednesday's flush to 1,594 was bought back inside two sessions. The Kijun-Sen is 1,760 and the top of the Cloud is near 1,780. The daily Ichimoku looks positioned for a strong move if price can push up and close above the Cloud, and the current Composite Index and Detrended Price Oscillator settings say the same thing. Until that close, it is a chart that looks ready, and looking ready is free.
The crowd helps here: platinum's Big Guys are 64% long, the least committed of the five metals on the board, which is the least crowded place for a breakout to start. Bulls are looking for long opportunities on a daily close above the Cloud and not before. Bears are comfortable while the Cloud holds and get interested again under 1,594.
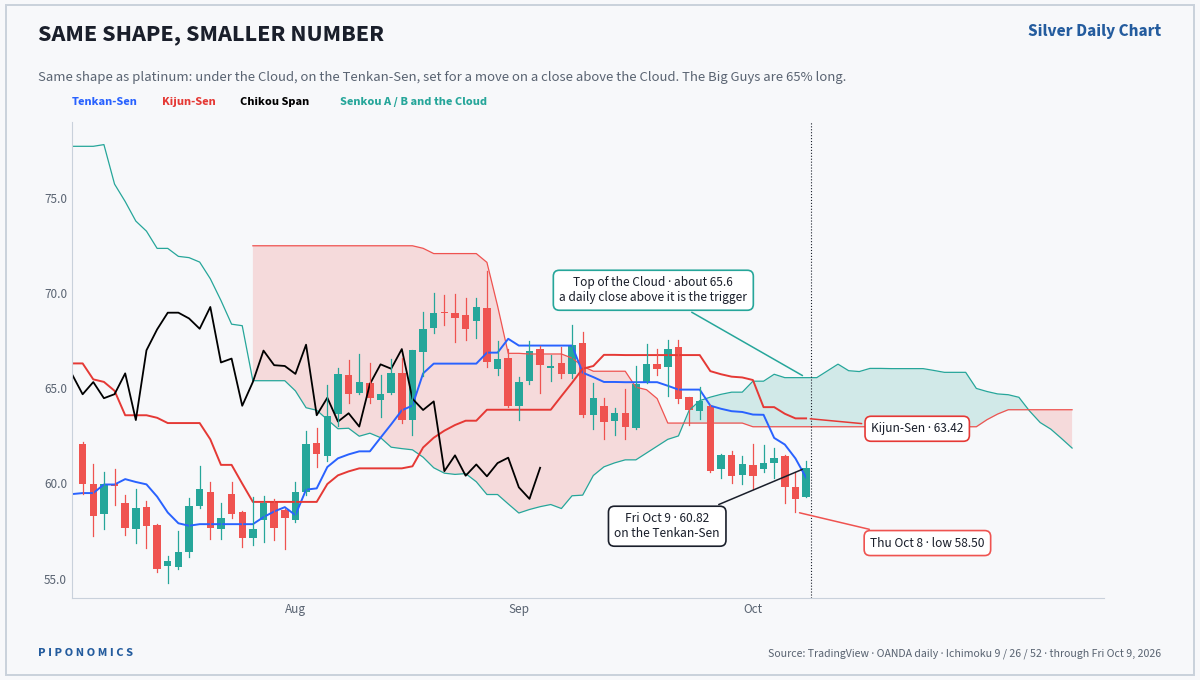
Silver looks really similar: 60.82, on the Tenkan-Sen at 60.30, Kijun-Sen at 63.42, Cloud from 63.0 to 65.6 overhead. Same trigger - a daily close above the Cloud - and the same oscillator setup underneath it.
The crowd is the difference. The Big Guys are 65% long after selling 2,846 longs in two weeks, and the small accounts still own 63% more of the market than they do. A breakout in silver would be carried by the wrong people first, which is how silver breakouts usually start and why they usually get retraced. Bulls want the close above 65.6; bears want the Thursday low at 58.50 to give way; everyone else waits.
06 THE WEEK AHEAD
What This Is: everything worth having on the radar between now and the triple that closes on November 5, in the order it arrives. Weekly.
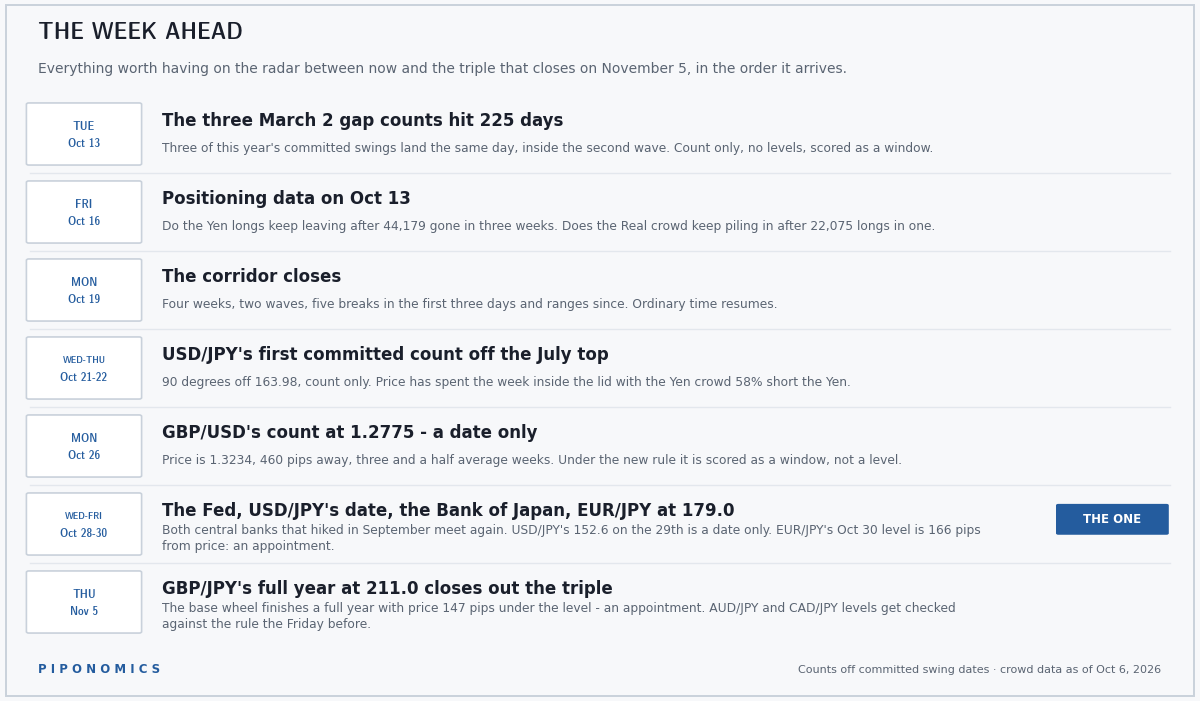
Tuesday October 13. The three March 2 gap counts hit 225 days on the same day. Count only, no levels, scored as a window.
Friday October 16. Positioning data on October 13 - whether the Yen longs keep leaving after 44,179 in three weeks, and whether the Real crowd keeps arriving after 22,075 in one.
Monday October 19. The corridor closes. Four weeks, two waves, five breaks in the first three days and ranges since.
Wednesday to Thursday, October 21 to 22. USD/JPY's first committed count off the 163.98 top, 90 degrees, count only - with price living inside the lid and the Yen crowd 58% short the Yen after quitting 44,179 longs.
Monday October 26. GBP/USD's count at 1.2775, 460 pips from price. A date, not an appointment, by the new rule. Scored as a window.
Wednesday to Friday, October 28 to 30. The Fed on the 28th, USD/JPY's 152.6 date on the 29th - 570 pips away, a date only, scored as a window - the Bank of Japan on the 30th, and EUR/JPY's appointment at 179.0 the same day the Bank of Japan speaks. The one stretch on this list that gets the badge.
Thursday November 5. GBP/JPY's full year at 211.0, an appointment 147 pips above price, closing out the triple. AUD/JPY's October 31 level and CAD/JPY's November 5 level are on the card and get checked against the rule the Friday before.
For information only. Not investment advice. Currency and futures trading carries substantial risk of loss. Do your own due diligence before acting on anything in this letter.
Terms & Conditions 📝
Securities Disclaimer: STOCKTWITS IS NOT A TAX ADVISOR, BROKER, FINANCIAL ADVISOR OR INVESTMENT ADVISOR. THE SERVICE IS NOT INTENDED TO PROVIDE TAX, LEGAL, FINANCIAL OR INVESTMENT ADVICE, AND NOTHING ON THE SERVICE SHOULD BE CONSTRUED AS AN OFFER TO SELL, A SOLICITATION OF AN OFFER TO BUY, OR A RECOMMENDATION FOR ANY SECURITY. Trading in such securities can result in immediate and substantial losses of the capital invested. You should only invest risk capital, and not capital required for other purposes. You alone are solely responsible for determining whether any investment, security or strategy, or any other product or service, is appropriate or suitable for you based on your investment objectives and personal and financial situation. You should also consult an attorney or tax professional regarding your specific legal or tax situation. The Content is to be used for informational and entertainment purposes only and the Service does not provide investment advice for any individual. Stocktwits, its affiliates and partners specifically disclaim any and all liability or loss arising out of any action taken in reliance on Content, including but not limited to market value or other loss on the sale or purchase of any company, property, product, service, security, instrument, or any other matter. You understand that an investment in any security is subject to a number of risks, and that discussions of any security published on the Service will not contain a list or description of relevant risk factors. In addition, please note that some of the stocks about which Content is published on the Service have a low market capitalization and/or insufficient public float. Such stocks are subject to more risk than stocks of larger companies, including greater volatility, lower liquidity and less publicly available information. Read the full terms & conditions here. 🔍