
PIPONOMICS · ISSUE 03 · MONDAY, OCTOBER 5, 2026 · COT AS OF SEP 29
Everyone Bought The Dollar
The Big Guys sold a net 65,000 contracts of Euro, Loonie, Yen and Pound in one week. The Yen crowd is now short, three weeks after it was long. Both Yen crosses closed their worst month in two years and the monthly trigger fired.
How crowded did the dollar get in seven days? Crowded enough that the Loonie row needed a wider bar. On Tuesday September 29 the Big Guys added 24,949 Canadian dollar shorts, 23,277 Euro shorts and 6,090 Yen shorts, sold 15,494 Yen longs and 11,381 Pound longs, and came out the other side a net 65,000 contracts longer the dollar than they went in. The Loonie crowd is 75% short. The Euro crowd is 57% short. The Yen crowd, which was 62% short on September 8, 56% long on the 15th and flat on the 22nd, is 54% short on the 29th.
Meanwhile the monthly close did what Issue 2 said it would. GBP/JPY finished September down 3.5%, the worst month since July 2024. EUR/JPY finished down 3.9%, the worst since November 2024. Both downside ideas are live from Thursday's open, and the 210.3 to 210.7 shelf turned a fourth test away the same morning.
01 THE LEDGER
What This Is: every level, date and idea from September 28, marked against what price did - misses and losses first, hits after, and anything pending or open at the bottom. A miss is a date or level that never got tested; a loss is one that got tested and failed. Weekly.
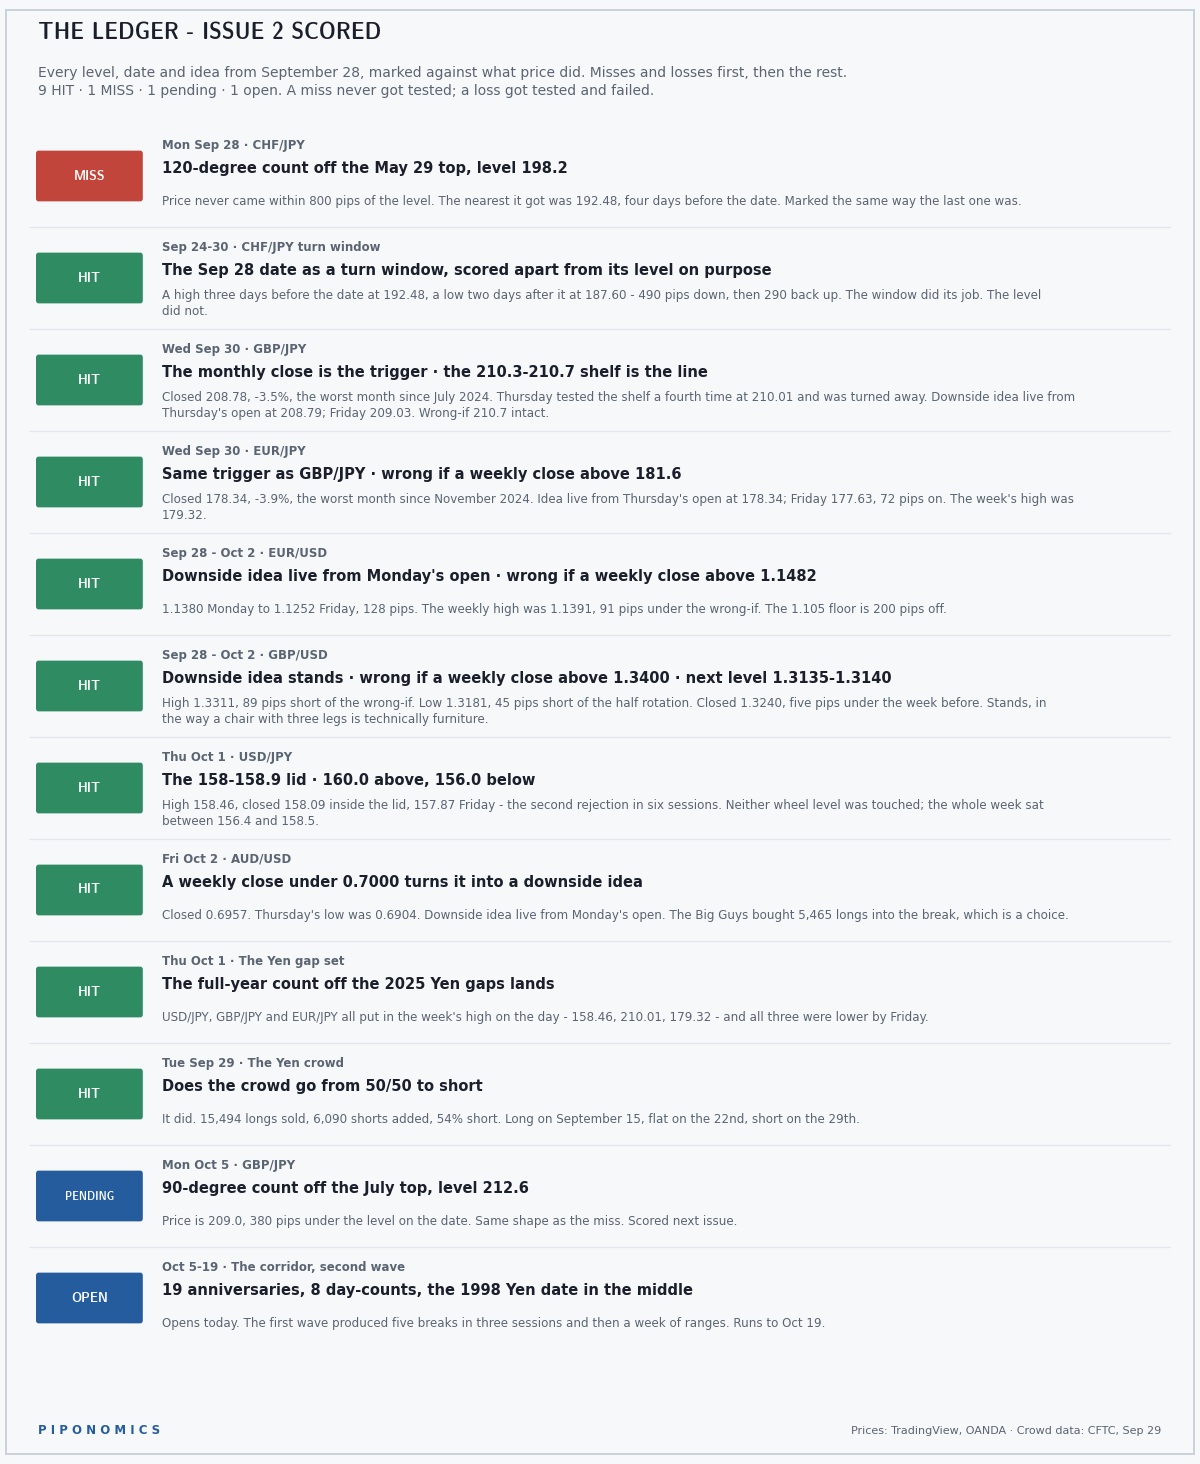
MISS - Monday September 28, CHF/JPY, the 120-degree count at 198.2. Price never came within squinting distance of that level.
HIT - September 24 to 30, CHF/JPY as a turn window. Scored apart from the level on purpose. The September 28 date got a high three days before it at 192.48 and a low two days after it at 187.60 - 490 pips down and 290 back up, with the date in the middle. The window worked. The level didn't.
HIT - Wednesday September 30, GBP/JPY, the monthly close as the trigger. Closed 208.78, down 3.5%, the worst month since July 2024. On Thursday price tested the 210.3 to 210.7 shelf a fourth time, reached 210.01, and was turned away. The downside idea is live from Thursday's open at 208.79; Friday closed 209.03. The wrong-if at 210.7 was never touched.
HIT - Wednesday September 30, EUR/JPY, same trigger. Closed 178.34, down 3.9%, the worst month since November 2024. Live from Thursday's open at 178.34; Friday 177.63, 72 pips on. The week's high was 179.32, well under the wrong-if at 181.6.
HIT - September 28 to October 2, EUR/USD, downside idea. 1.1380 at Monday's open to 1.1252 Friday, 128 pips. The wrong-if at 1.1482 was never approached; the week's high was 1.1391. The 1.105 floor is 200 pips off.
HIT - September 28 to October 2, GBP/USD, downside idea. The high was 1.3311, 89 pips short of the wrong-if. The low was 1.3181, 45 pips short of the half rotation at 1.3135. It closed at 1.3240, five pips under the week before. The idea stands, in the way a chair with three legs is technically furniture.
HIT - Thursday October 1, USD/JPY, the lid. High 158.46, close 158.09 inside the 158 to 158.9 band, 157.87 by Friday. The second rejection in six sessions. The two wheel levels left on the card, 160.0 above and 156.0 below, were never touched; the whole week sat between them.
HIT - Friday October 2, AUD/USD, the trigger. A weekly close under 0.7000 was the line. It closed 0.6957, and Thursday's low was 0.6904. The downside idea is live from this morning's open. The Big Guys bought 5,465 longs into the break, which is a choice.
HIT - Thursday October 1, the Yen gap set's full-year count. USD/JPY, GBP/JPY and EUR/JPY all put in the week's high on the day - 158.46, 210.01 and 179.32 - and all three were lower by Friday. A count with no level attached, scored only on whether the day turned.
HIT - Tuesday September 29, the Yen crowd. The question was whether a crowd that went from long to flat keeps going to short. It did. 15,494 longs sold, 6,090 shorts added, 54% short.
PENDING - Monday October 5, GBP/JPY, the 90-degree count at 212.6. Today. Price is 209.0, 380 pips under the level. Same shape as the miss, and it gets scored next week the same way.
OPEN - the corridor's second wave, October 5 to 19. Opens today. The first wave produced five breaks in its first three sessions and then a week of ranges, which is the second act of every alien-invasion film: the ships have arrived and now they hover.
Nine hits, one miss, one pending, one open. Before anybody gets a big head: four of the nine hits are ideas, together they're worth about 180 pips, one of them is underwater, and the one that did the most, EUR/USD, has a known floor beneath it.
02 THE PILE-UP
What This Is: who is crowded, and how badly. Weekly, from the CFTC Traders in Financial Futures report, futures only, September 29.
The Big Guys are the professional speculators - hedge funds and CTAs. A crowded position is a loaded spring.
Retail is the small-account money, on the row beneath. Asset managers are left off on purpose - they hedge, they don't chase.
Each bar is one group's own position, split long against short. Never one group netted against another. "Was" is the prior week.
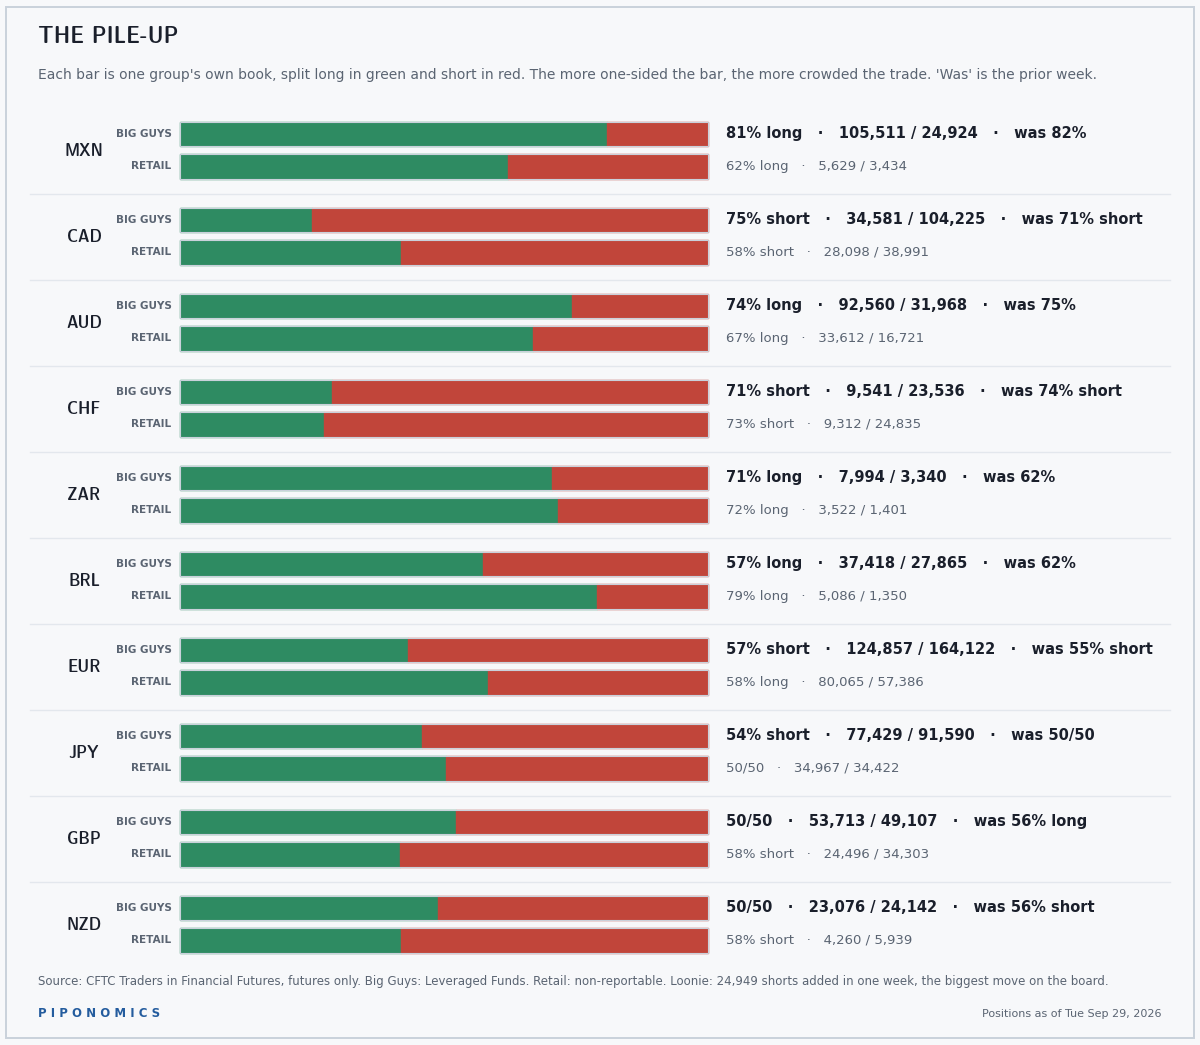
Loonie, 75% short - 24,949 shorts added in one week, the biggest move on this week's board by a distance. Two weeks ago they covered 15,510. Last week they added 10,397 back. This week they added 24,949 more. The Loonie crowd went in like the Rebel fleet at Endor: they know it's a trap, they say it's a trap, they go anyway.
Euro, 57% short. 23,277 shorts added and 10,706 longs added in the same week, so everybody bought a ticket again, but this time most of them picked the same seat. EUR/USD fell 128 pips.
Pound, 50/50, down from 56% long. 11,381 longs sold, the second-biggest selling on the board. GBP/USD rewarded them with a week that moved five pips.
Aussie, 74% long after a week that closed under 0.70. The Big Guys bought 5,465 longs and added 3,599 shorts, which is both sides adding to a market that just broke.
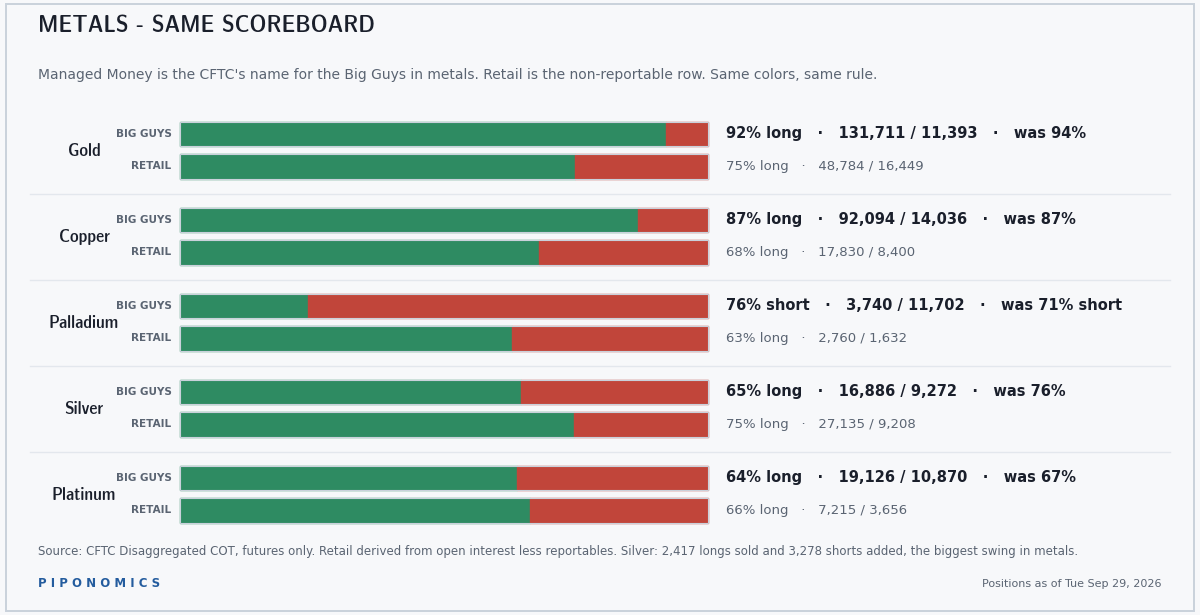
Gold, 92% long, down from 94%.
Silver, 65% long, down from 76%. 2,417 longs sold, 3,278 shorts added, the biggest swing in metals. And the standing oddity got stranger: Retail holds 27,135 longs against the Big Guys' 16,886. The interns own 60% more of the building than the partners now, and nobody has called a meeting.
Copper, 87%, 4,327 longs sold after last week's 12,717 were bought back. Platinum, 64%, down from 67%. Palladium, 76% short, up from 71% - the one metal the Big Guys lean against, and they leaned harder.
03 THE APPOINTMENT BOOK
What This Is: when a market is most likely to turn.
One pair at a time. Counts run forward from a confirmation swing. GBP/USD counts in calendar days. GBP/JPY counts in degrees of the year, where 360 is one year.
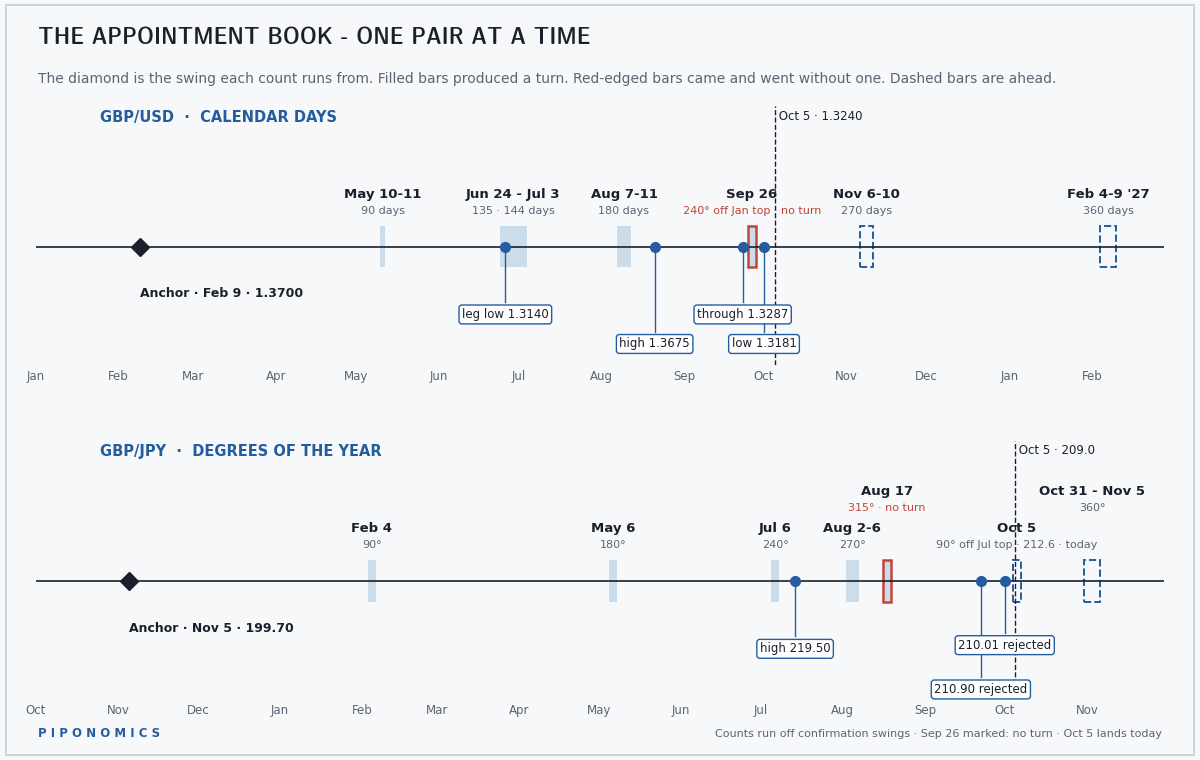
GBP/JPY's 90-degree count at 212.6 lands today. Price is 209.0. The shelf at 210.3 to 210.7, which has turned away two bounces in two weeks, sits between price and the level. This is the same shape that produced both misses so far: a dated level with price nowhere near it.
The Yen gap set's full-year count, Thursday October 1, produced the week's high in all three Yen pairs - USD/JPY 158.46, GBP/JPY 210.01, EUR/JPY 179.32. It had no level attached and didn't need one.
GBP/USD's next: 270 days, November 6 to 10. Thursday's low at 1.3181 is now a swing the next counts can run from if it holds. USD/JPY's first committed count off the 163.98 top: 90 degrees, October 21 to 22, three days after the corridor closes. GBP/JPY: the full year, October 31 to November 5.
Scar Tissue - the whole calendar. The market has a memory. Crashes, spikes and record ranges leave a mark, and price has a habit of reacting again on their anniversaries - especially the round ones. Master years are squares, sevens and decades.
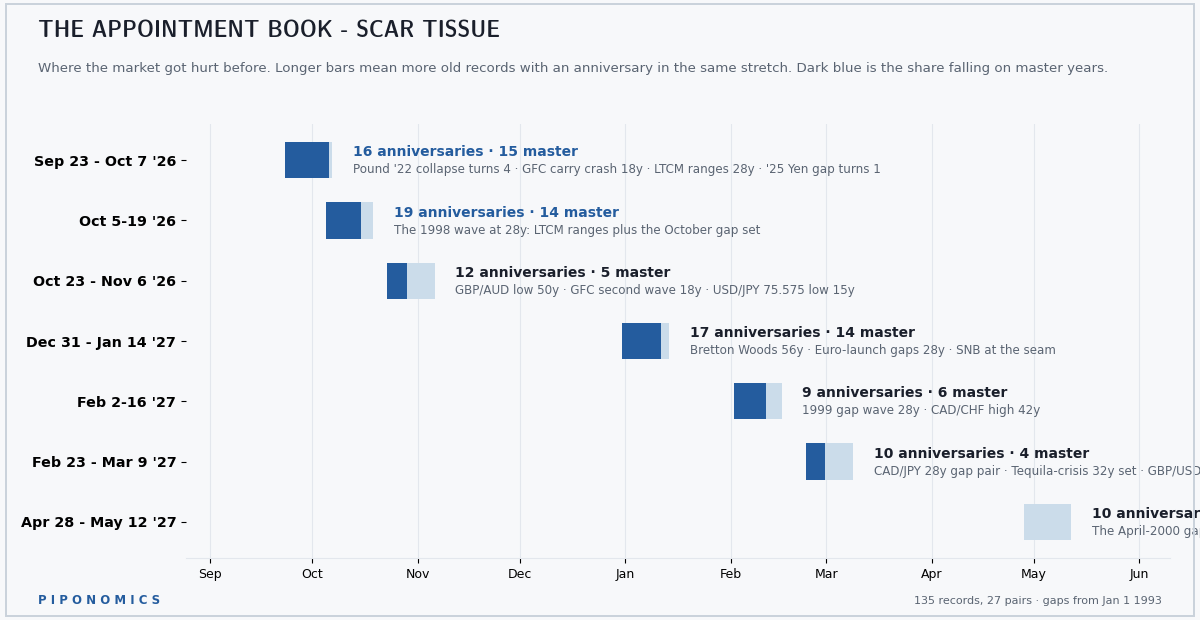
Wednesday and Thursday, October 7 to 8: the 1998 Yen crash turns 28. Back then, the USD/JPY fell from the 130s to the 110s in two sessions as the carry trade unwound. Four sevens, a master year, and it arrives with the Yen crowd just gone short and both Yen crosses already off their worst month in two years. Even the Doctor doesn't get to rewrite a fixed point.
The LTCM ranges, same stretch, same 28 years. The second wave of the corridor is heavy on 1998 for a reason. The 2008 October ranges turn 18, which is not a master year, and they are on the calendar anyway because 2008 is on every calendar.
Where the two agree. This year's own day-counts run off 36 committed swing dates. When they pile up in the same days as the old anniversaries, two separate systems picked the same stretch without consulting each other.
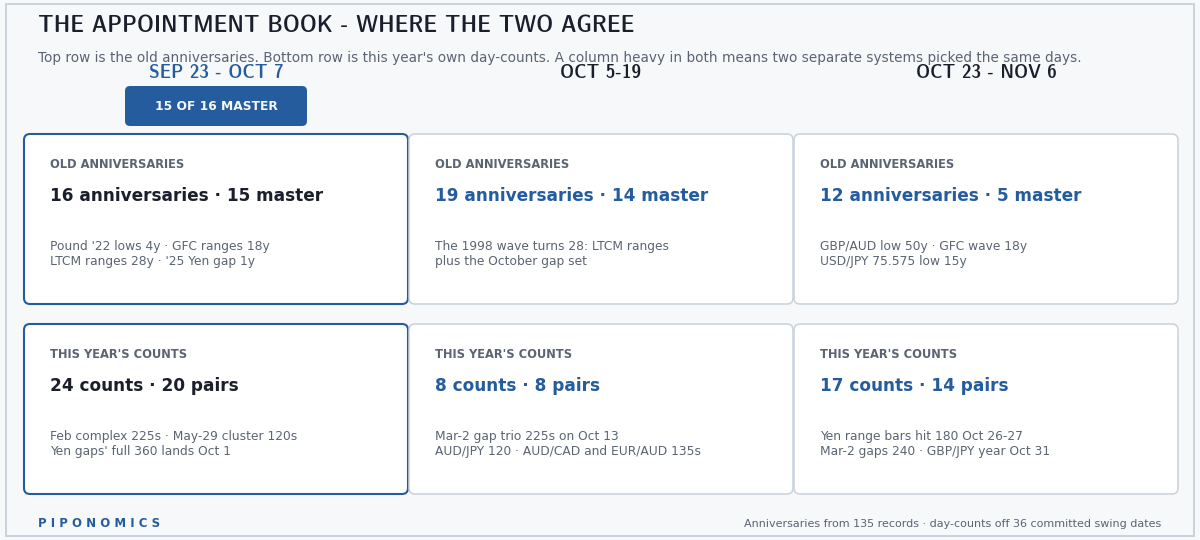
The first wave, September 23 to October 7, did what it said it might - five breaks in the first three sessions, the Yen gap count on October 1, and then a week where the majors sat in ranges and the Yen crosses finished a month.
The second wave, October 5 to 19, opens today - 19 anniversaries to the first wave's 16, but 8 day-counts to its 24. More scar tissue, less of this year's calendar. The three March 2 gap counts land together on October 13. What it runs into: a dollar crowd that just added 65,000 contracts in a week, a Yen crowd on its third side of the trade in a month, and two Yen crosses with live downside ideas and the nearest Ichimoku support 600 to 700 pips below.
04 PRICE AND TIME
What This Is: Gann's wheels turn a major price into a set of levels and a set of dates. Run a major top through the Square of Nine - plus the Hexagon chart on Yen pairs - and it produces levels where declines tend to pause and dates when turns tend to happen. Updated as levels are tested, and two systems lined up twice this week.
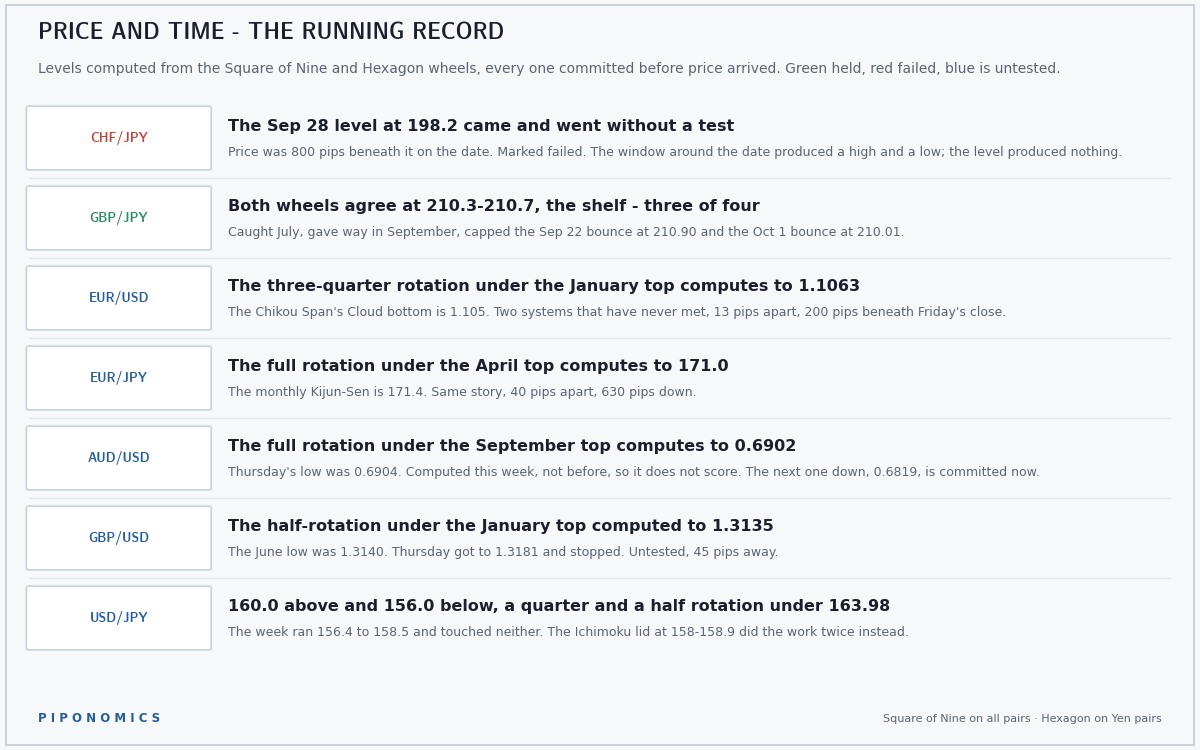
CHF/JPY's September 28 level is marked failed. Price was 800 pips beneath it on the date. The window around the date turned twice; the level did nothing. Marked red.
GBP/JPY's shelf is three of four. Caught July, gave way in September, capped the September 22 bounce at 210.90 and the October 1 bounce at 210.01. A level that holds three times out of four is the Black Knight from Holy Grail if the Black Knight were winning.
EUR/USD's three-quarter rotation under the January top computes to 1.1063. The January high was 1.2083, which rides the wheel as 1208. (√1208 - 1.5)² = 1106.3, or 1.1063. The Chikou Span's Cloud bottom on the weekly chart is 1.105. Two systems that have never met, 13 pips apart, 200 pips beneath Friday's close. That's the floor under the EUR/USD idea now.
EUR/JPY's full rotation under the April top computes to 171.0. The April high was 187.95. The monthly Kijun-Sen is 171.4. Same story, 40 pips apart, 630 pips down, with no support in between.
AUD/USD's full rotation under the September top computes to 0.6902. Thursday's low was 0.6904. Computed this week, not before, so it does not score and does not get to brag. The next one down, 0.6819, is committed now, and it does.
GBP/USD's 1.3135 is untested, 45 pips away. Thursday got to 1.3181 and stopped. USD/JPY's 160.0 and 156.0 are untested - the week ran 156.4 to 158.5 and the Ichimoku lid did the work twice instead.
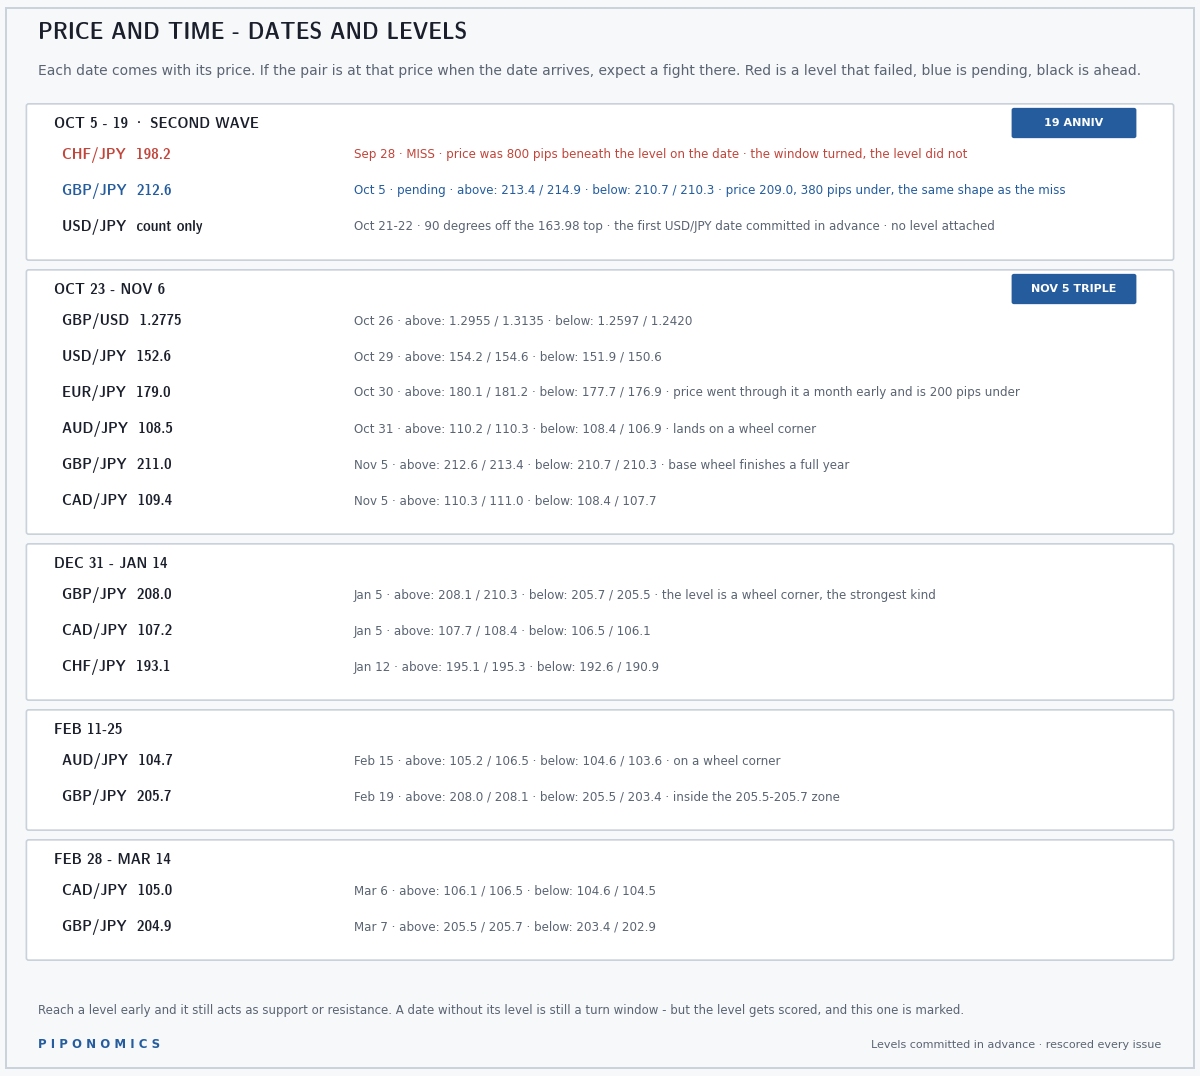
Today, GBP/JPY at 212.6. Price is 209.0.
October 21 to 22, USD/JPY, count only. The first USD/JPY date committed in advance, with no level attached, on purpose. The Yen gap count on October 1 worked without one.
October 26, GBP/USD at 1.2775. Price is 1.3240, 465 pips away with three weeks to go. Same shape as the miss.
October 30, EUR/JPY at 179.0. Price went through it a month early and is 200 pips beneath it. If the date produces anything now it produces a bounce into it, not a fall from it.
05 MONEY WHERE THE MOUTH IS
What This Is: the charts worth a look, and what the opinion is. Every idea carries the level that proves it wrong.
EUR/USD - downside idea stands, 128 pips on, halfway to the floor.
The weekly closed at 1.1252, a second week under the Cloud, 128 pips lower than the first.
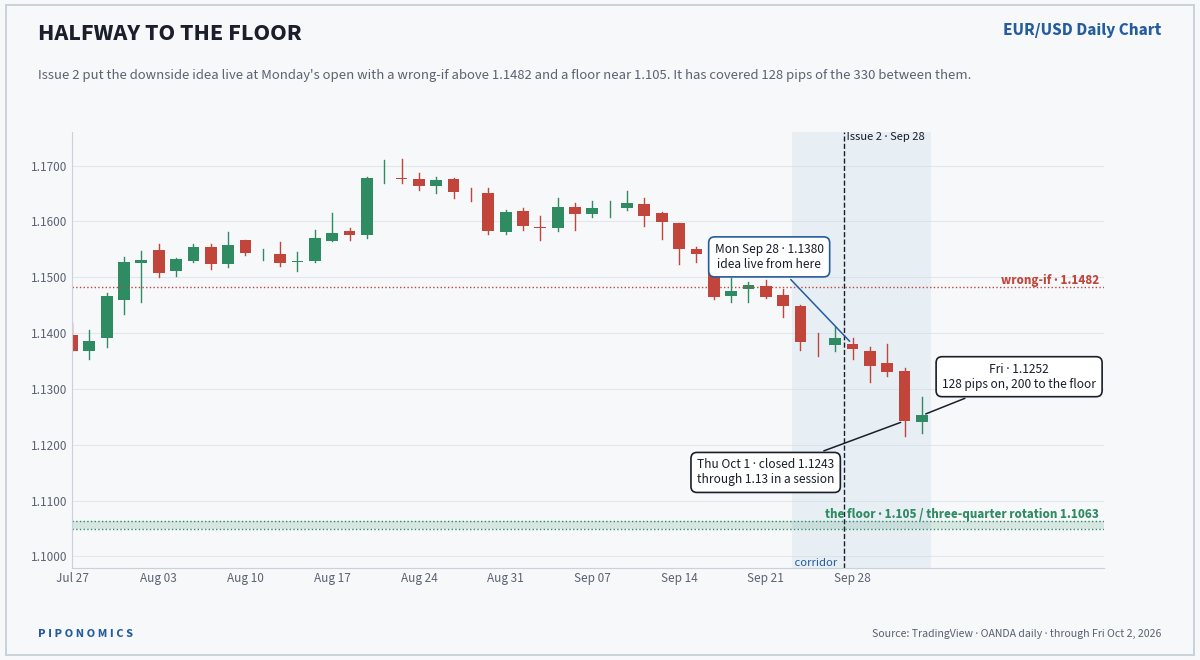
Thursday closed at 1.1243, through 1.13 in a session. Friday held it. The week's high was 1.1391, 91 pips under the wrong-if.
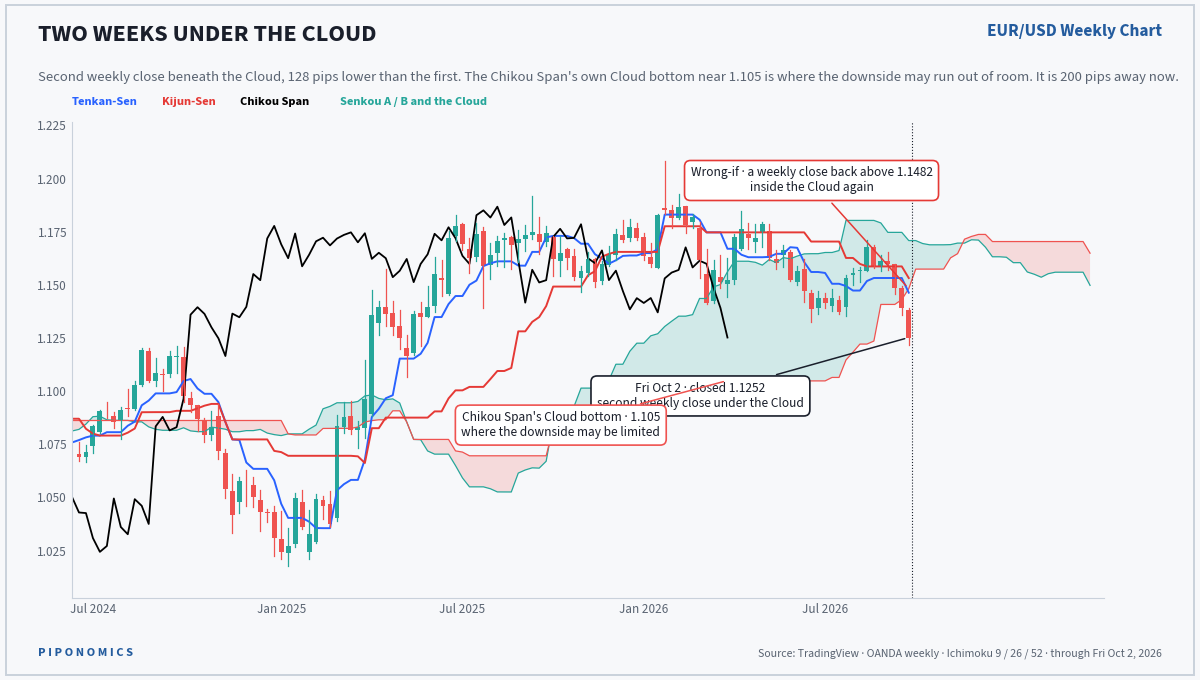
On the weekly the breakout is doing what an ideal bearish Ichimoku breakout does: price under the Cloud, under the Tenkan-Sen and Kijun-Sen, the Composite Index and Detrended Price Oscillator both pointed the same way. The second week confirmed the first.
The floor is the part to respect. The Chikou Span's Cloud bottom sits near 1.105, the three-quarter rotation under the January top computes to 1.1063, and the two have never been introduced. That's 200 pips down, and it's where this idea gets reassessed. Halfway to the floor is the Fellowship at the Bridge of Khazad-dûm - the easy part is behind you and nobody has said the word Balrog yet.
Wrong if the weekly close is back above 1.1482 - inside the Cloud again, and the whole idea is gone. The wrong-if stays put this week, 230 pips overhead.
GBP/USD - downside idea stands, after a week of nothing.
Closed 1.3240, five pips under last Friday. The high of the week was 1.3311, the low 1.3181.
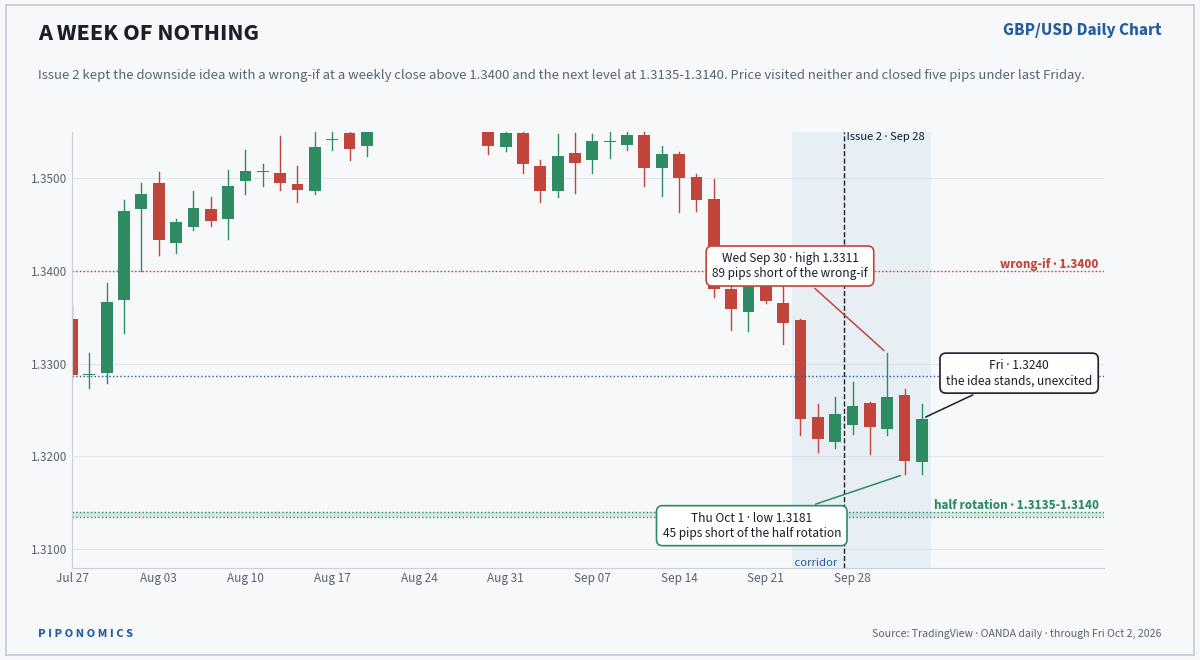
The wrong-if at 1.3400 was 89 pips away at the worst moment. The half rotation at 1.3135 to 1.3140 was 45 pips away at the best one. In between, five sessions of second breakfast: it happened, it was pleasant, nothing came of it.
The Big Guys sold 11,381 Pound longs into it and got nothing for the trouble. The crowd is now 50/50, which removes the crowd as a reason to be on either side. What is left is the level: 1.3135, where the June low landed and the wheel says a half rotation ends. Wrong if the weekly close is back above 1.3400. Unchanged.
GBP/JPY - downside idea, live from Thursday's open at 208.79.
The month closed at 208.78, the trigger fired, and the shelf turned away a fourth test the next morning.
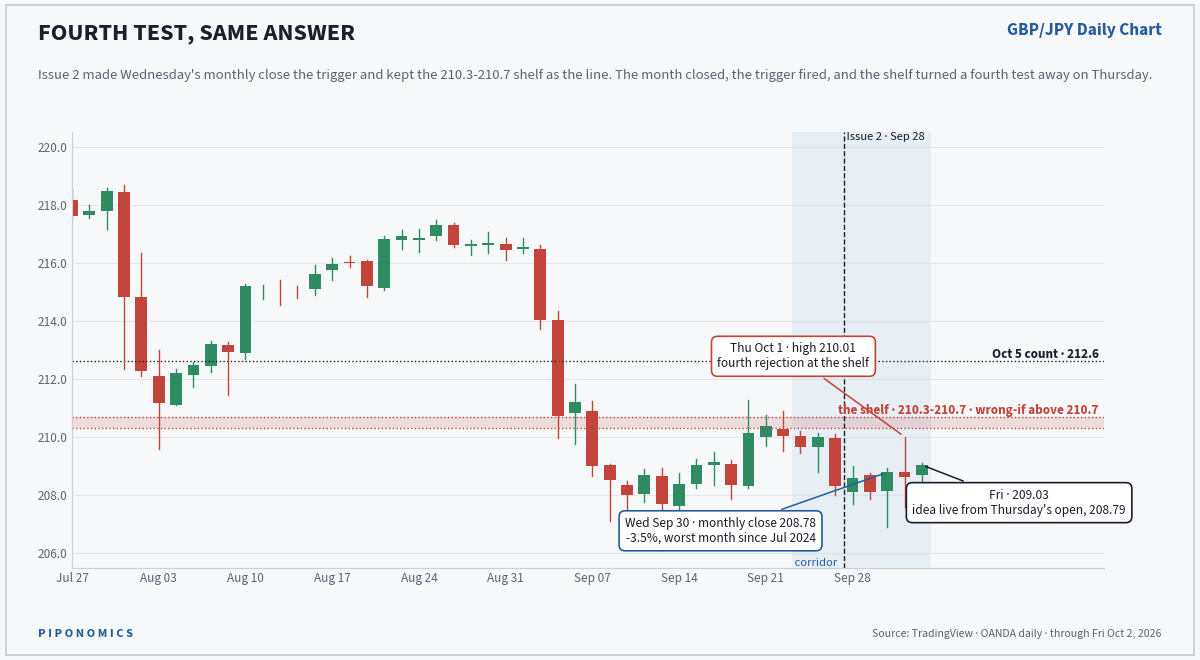
Thursday's high was 210.01. The shelf is 210.3 to 210.7. Price got within 30 pips and left. That is four tests - one hold, one failure, two rejections.
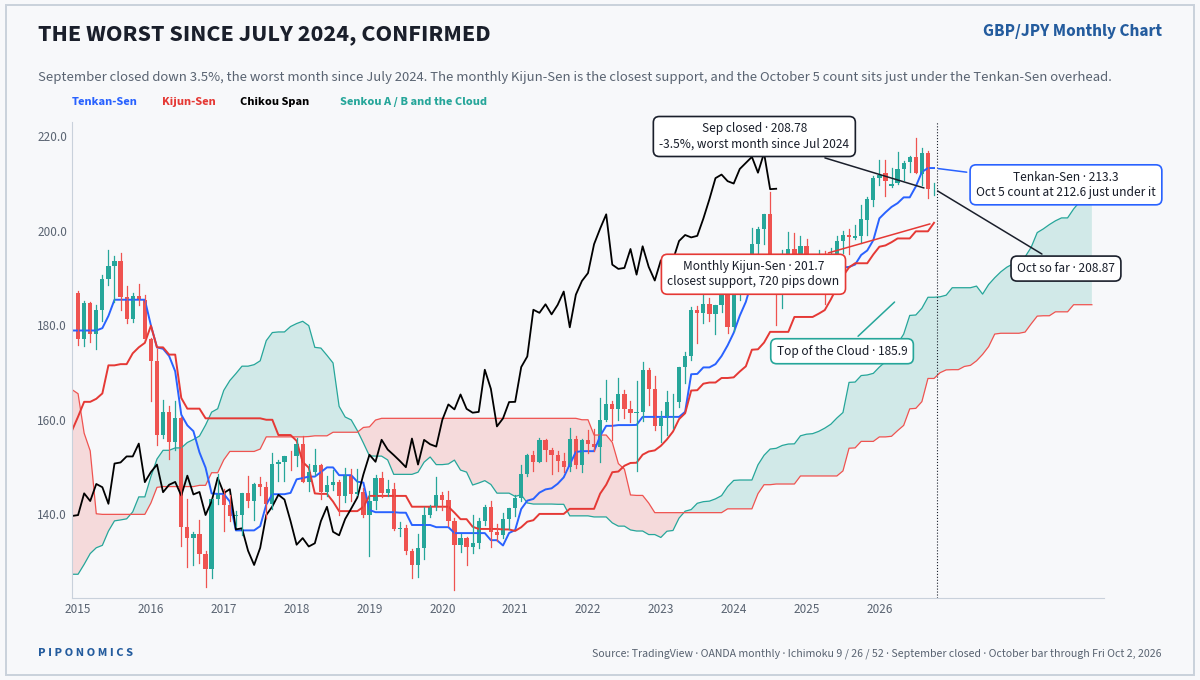
September closed down 3.5%, the worst month since July 2024, with the monthly Detrended Price Oscillator through zero. The Composite Index is at its near-term support zone, the one that goes back to 2018; the zone that would stop a drive like this is the 2008 and 2016 one, a long way beneath it.
The monthly Kijun-Sen moved up to 201.7 with the new bar and is still the closest Ichimoku support, 720 pips down. Overhead, the October 5 count at 212.6 sits just under the monthly Tenkan-Sen at 213.3, so a bounce has two things to get through and the shelf before either of them.
Friday closed 209.03, 24 pips above Thursday's open. The idea is live and slightly underwater. Wrong if a weekly close is back above 210.7 - the top of the shelf.
EUR/JPY - downside idea, live from Thursday's open at 178.34.
Same trigger, same close, cleaner chart, and 72 pips on by Friday.
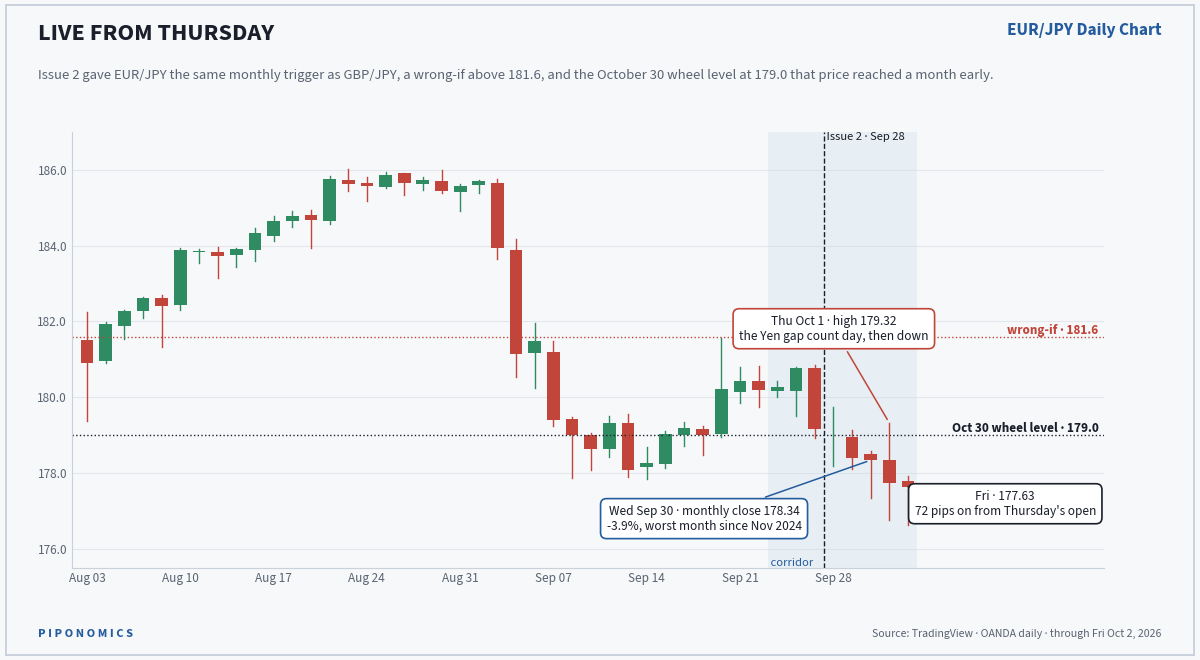
The week's high was 179.32 on Thursday, the Yen gap count day, and the pair fell 270 pips from there to Friday's low at 176.61. The October 30 wheel level at 179.0 is already behind it, a month early.
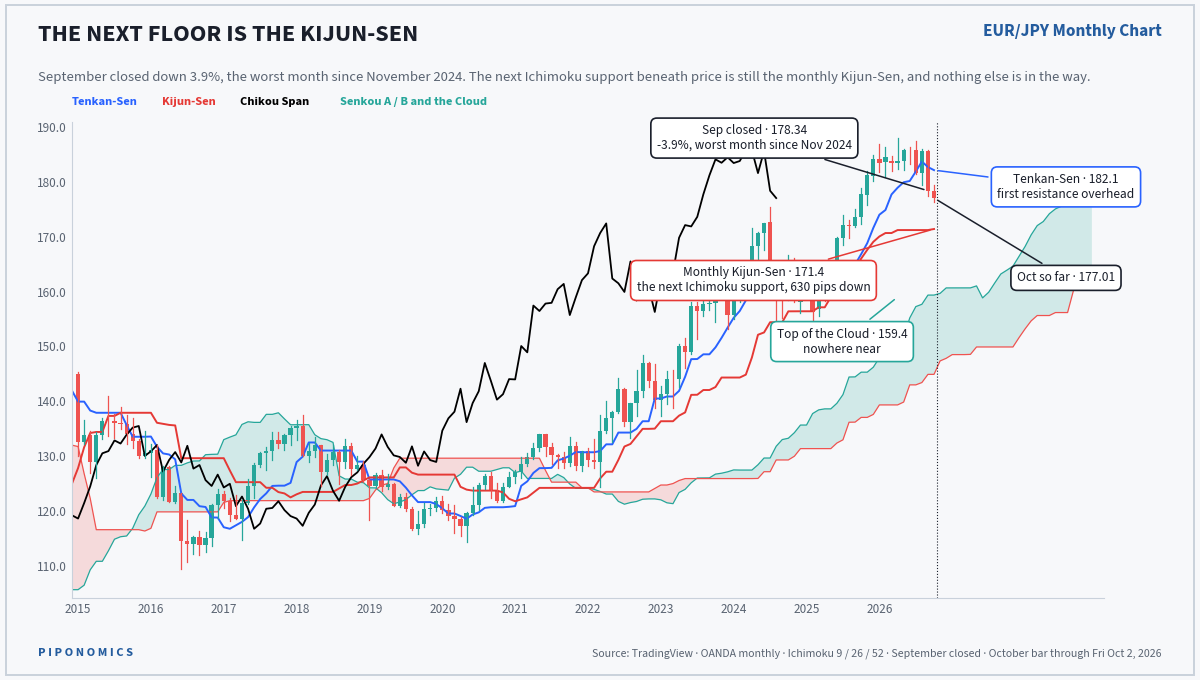
September closed down 3.9%, the worst month since November 2024. The Detrended Price Oscillator crossing and closing below zero on a monthly chart is the major warning sign it was called last week, and now the bar is closed.
The Composite Index is approaching its historical support zone. That could be a floor, or it could be the index warning that a drive south is likely given where the DPO is. With the DPO under zero, I'm going with the second reading.
The next Ichimoku support is the monthly Kijun-Sen at 171.4, 630 pips down, and the wheel's full rotation under the April top sits at 171.0. Two systems, 40 pips apart, and no support on the chart between here and there.
Wrong if a weekly close is back above 179.4 - Thursday's high and the half rotation under the April top, in the same place. The wrong-if moves down from 181.6 because the chart gave it a better level.
AUD/USD - downside idea, live from this morning's open.
Friday's weekly close at 0.6957 was the trigger, and the Big Guys bought into it.
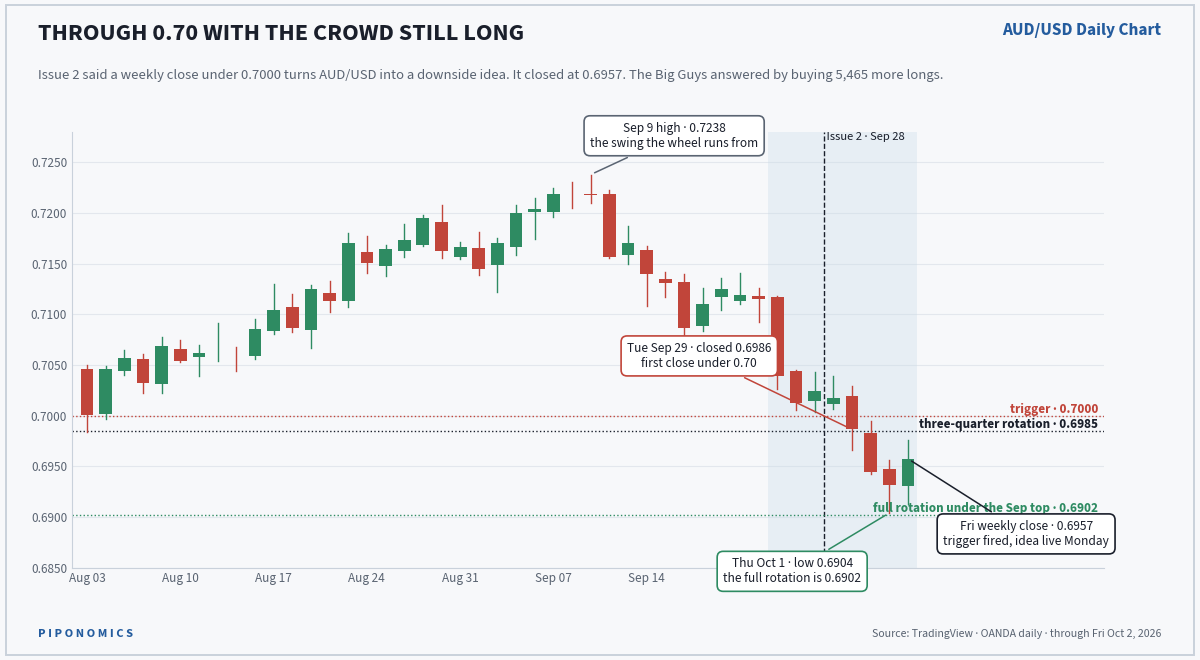
Tuesday was the first close under 0.70. Thursday's low at 0.6904 came within two pips of the full rotation under the September top at 0.6902. That level wasn't on the card in advance, so it doesn't count. The next one down, 0.6819, is on the card now.
The reason the idea exists is the row on the Pile-Up: 74% long and buying after a 150-pip drop and a close under a round number. That is the crowd that gets unwound, and so far it's still adding - 5,465 more longs last week.
Wrong if the weekly close is back above 0.7043, the September 25 high, which is the last place the crowd was comfortable.
USD/JPY - nothing yet, but the squeeze has changed direction.
157.87, between the wheel's 156.0 and 160.0, with the lid at 158 to 158.9 having turned away two bounces in six sessions.
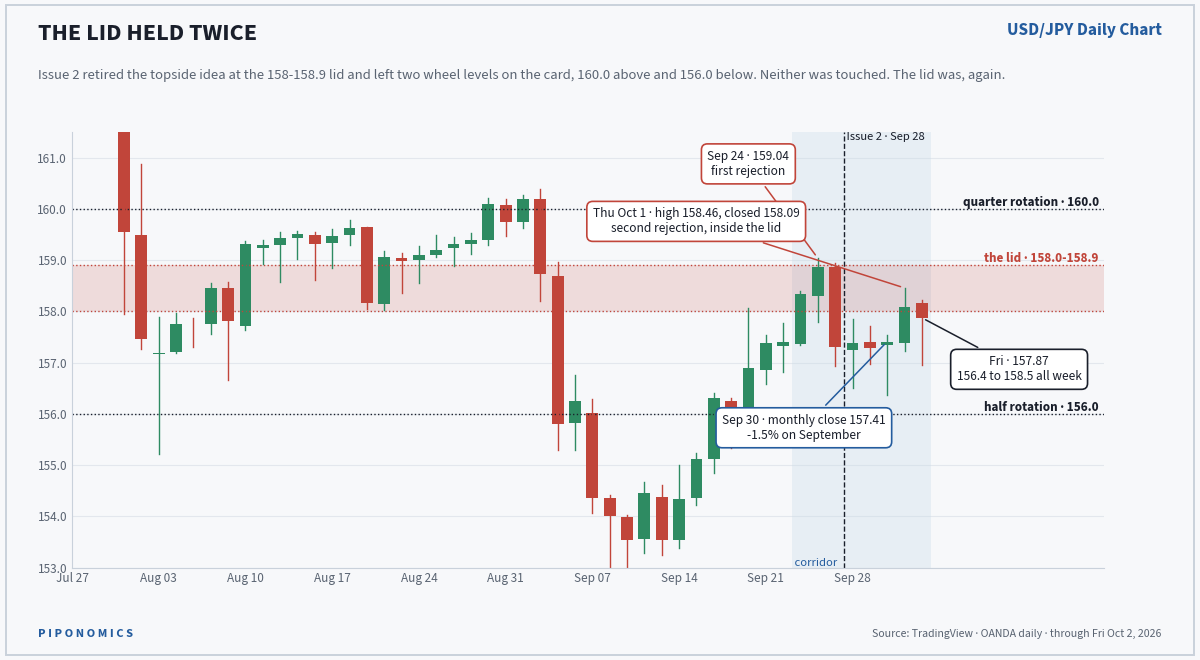
Three weeks ago the crowd was long the Yen into a rally and got stopped. Now the crowd is 54% short the Yen into a lid that has held twice. A daily close under 156.0 with that crowd in place is the downside idea.
Four downside ideas standing - EUR/USD, GBP/USD, GBP/JPY, EUR/JPY - one more live from this morning in AUD/USD, and USD/JPY waiting on a close.
06 THE WEEK AHEAD
What This Is: everything worth having on the radar between now and the end of the corridor, in the order it arrives. Weekly.
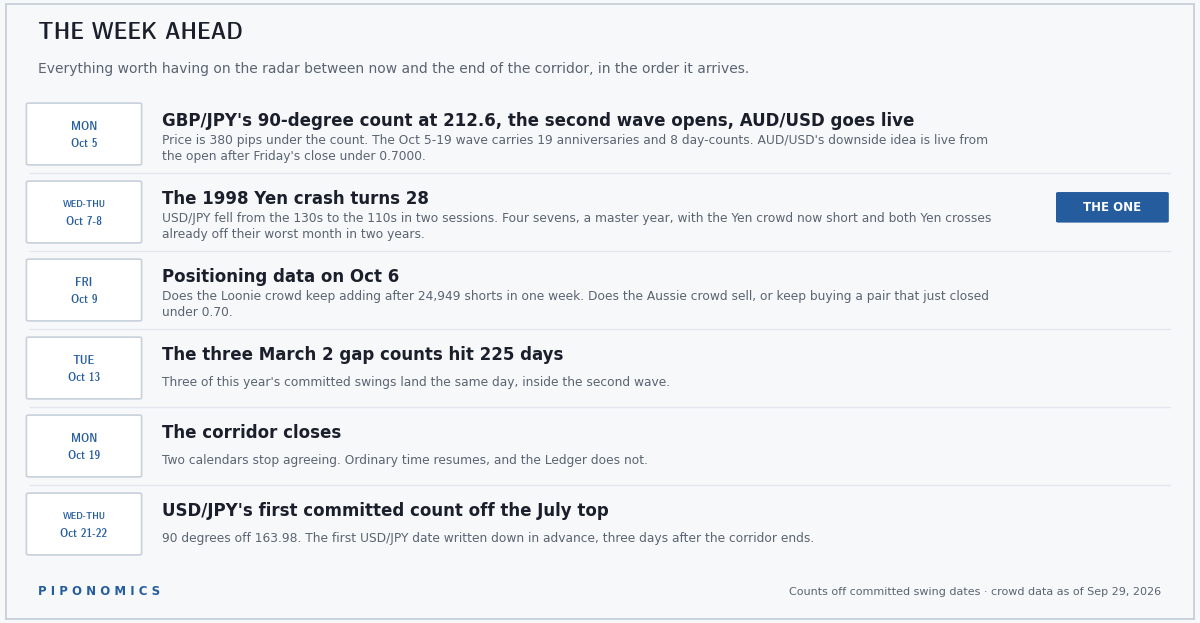
Monday October 5. GBP/JPY's 90-degree count at 212.6, with price 380 pips under it. The second wave of the corridor opens - 19 anniversaries, 8 day-counts. AUD/USD's downside idea goes live at the open.
Wednesday to Thursday, October 7 to 8. The 1998 Yen crash turns 28, a master year, inside the corridor, with the Yen crowd short and both Yen crosses live to the downside.
Friday October 9. Positioning data on October 6 - whether the Loonie crowd keeps adding after 24,949 shorts in a week, and whether the Aussie crowd sells or keeps buying a pair that closed under 0.70.
Tuesday October 13. The three March 2 gap counts hit 225 days together, inside the second wave.
Monday October 19. The corridor closes.
Wednesday to Thursday, October 21 to 22. USD/JPY's first committed count off the July top, 90 degrees, with no level attached and the Yen crowd on whichever side it is on by then.
For information only. Not investment advice. Currency and futures trading carries substantial risk of loss. Do your own due diligence before acting on anything in this letter.
Terms & Conditions 📝
Securities Disclaimer: STOCKTWITS IS NOT A TAX ADVISOR, BROKER, FINANCIAL ADVISOR OR INVESTMENT ADVISOR. THE SERVICE IS NOT INTENDED TO PROVIDE TAX, LEGAL, FINANCIAL OR INVESTMENT ADVICE, AND NOTHING ON THE SERVICE SHOULD BE CONSTRUED AS AN OFFER TO SELL, A SOLICITATION OF AN OFFER TO BUY, OR A RECOMMENDATION FOR ANY SECURITY. Trading in such securities can result in immediate and substantial losses of the capital invested. You should only invest risk capital, and not capital required for other purposes. You alone are solely responsible for determining whether any investment, security or strategy, or any other product or service, is appropriate or suitable for you based on your investment objectives and personal and financial situation. You should also consult an attorney or tax professional regarding your specific legal or tax situation. The Content is to be used for informational and entertainment purposes only and the Service does not provide investment advice for any individual. Stocktwits, its affiliates and partners specifically disclaim any and all liability or loss arising out of any action taken in reliance on Content, including but not limited to market value or other loss on the sale or purchase of any company, property, product, service, security, instrument, or any other matter. You understand that an investment in any security is subject to a number of risks, and that discussions of any security published on the Service will not contain a list or description of relevant risk factors. In addition, please note that some of the stocks about which Content is published on the Service have a low market capitalization and/or insufficient public float. Such stocks are subject to more risk than stocks of larger companies, including greater volatility, lower liquidity and less publicly available information. Read the full terms & conditions here. 🔍