
PIPONOMICS · ISSUE 01 · MONDAY, SEPTEMBER 21, 2026
Welcome to Piponomics, the newest Stocktwits newsletter about the FX market.
First, 10 seconds of FX 101.
A currency pair tells you how much of the second currency it takes to buy the first. If USD/JPY rises, the dollar is strengthening against the Yen. The Yen is weakening. A pip is the standard unit of movement - the second decimal on Yen pairs and the fourth decimal on most others.
Now for the fun part.
On Tuesday, September 15, hedge funds finished covering a Yen short they had spent most of the summer building and flipped net long - 110,302 long contracts against 87,132 short, or 56% long.
Wednesday, the Federal Reserve raised rates 25 basis points to 3.75%-4.00%, its first hike in three years, on a unanimous vote.
Friday, the Bank of Japan raised rates to 1.25%, the highest since 1995, on a 7-2 vote.
Two central banks tightened inside three days.
USD/JPY went from 153.55 to 156.87, roughly 330 pips.
Wrong direction if you had just bought the Yen.
The crowd was wrong at the top when it was short. It is now positioned to be wrong at the bottom, having gone long. That is the whole issue.
Five sections. Same order every week. Every date and price level gets written down before price arrives. Starting next issue, they get scored in public. Failures first.
And the first major timing window - what we call the corridor - opens Wednesday.
01 THE PILE-UP
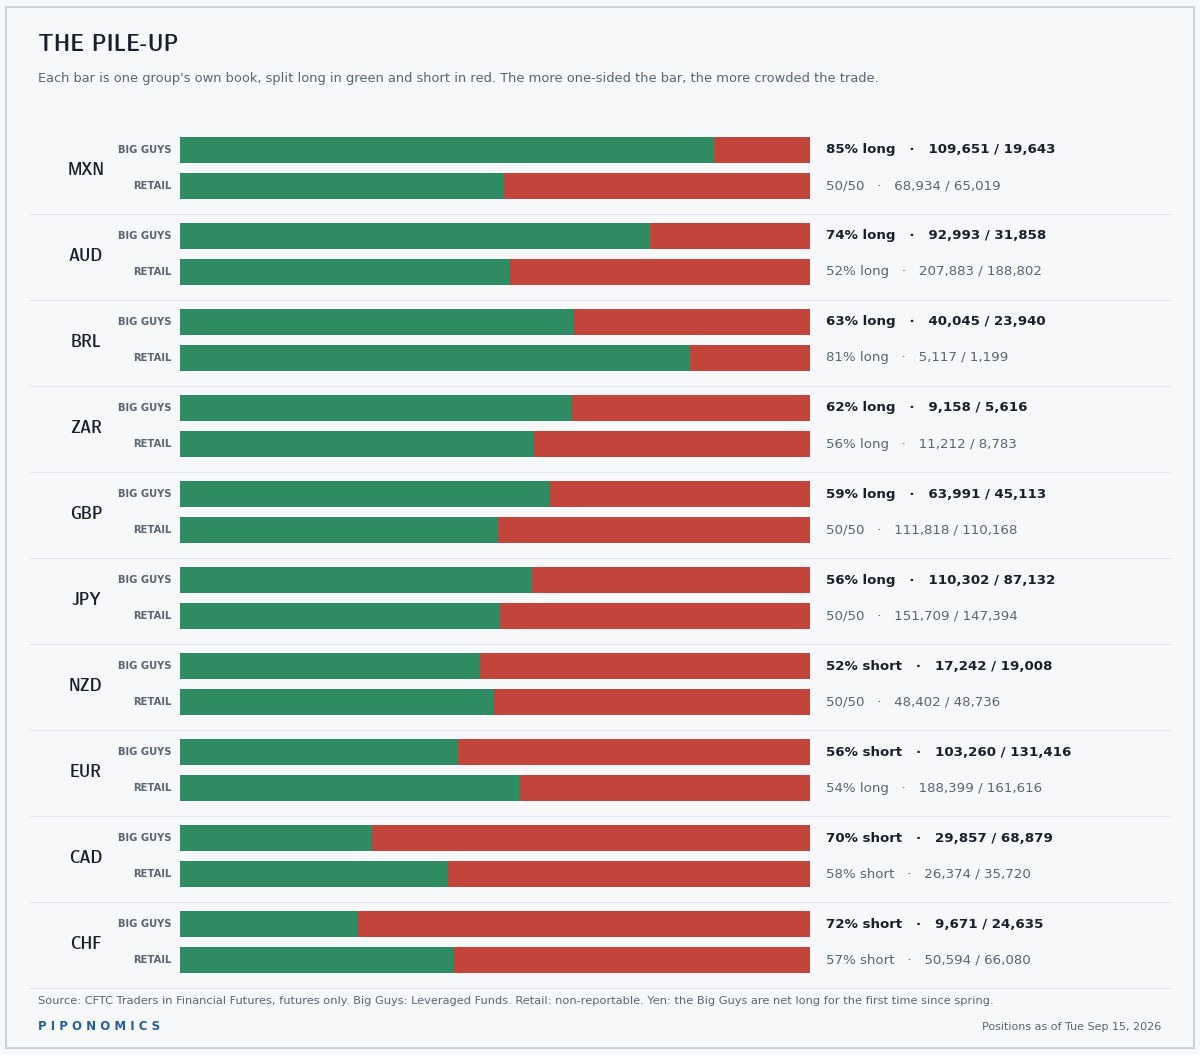
What This Is: This shows which currencies the big speculative traders (hedge funds, proprietary trading desks, etc) are betting on, and whether too many of them are leaning the same way. The more crowded a trade gets, the more violent the move can be when that crowd starts heading for the exit.
The Big Guys are the professional speculators - hedge funds and CTAs. A crowded position is a loaded spring. From here on they’re just the Big Guys.
Retail is the small-account money, on the row beneath. Asset managers are left off on purpose - they hedge, they don’t chase.
Each bar shows one group's own position split between long and short.
Long (Green) = betting the currency rises, Short (Red) = betting it falls.
The lopsided ones and the big moves:
Yen, 56% long - and they were 62% short a week earlier. 43,726 shorts covered, 28,542 longs added. It was the largest one-week reversal on the board this year, and it landed the day before the Fed. USD/JPY then rose 330 pips. The people who chased the Yen higher are now the people holding the bag at the bottom.
Peso, 85% long - the most crowded position on the board now, and it got there by shorts leaving rather than longs arriving. A crowd that grows because the other side walked off is a crowd with nobody to sell to.
Aussie, 74% long. The Big Guys added 5,015 longs and cut 6,341 shorts in the same week.
Loonie, 70% short - the Canadian dollar. 15,510 shorts covered, the second-biggest covering on the board after the Yen. Two weeks ago it was 78%.
Kiwi, 50/50 - the New Zealand dollar. Five weeks ago the Big Guys were 91% short. The most crowded position in currencies is now no position at all.
Pound, 59% long, the Big Guys adding 10,404 shorts in the week before the Bank of England met. Real, 63% long, 8,629 shorts added back.
Metals - Same Scoreboard
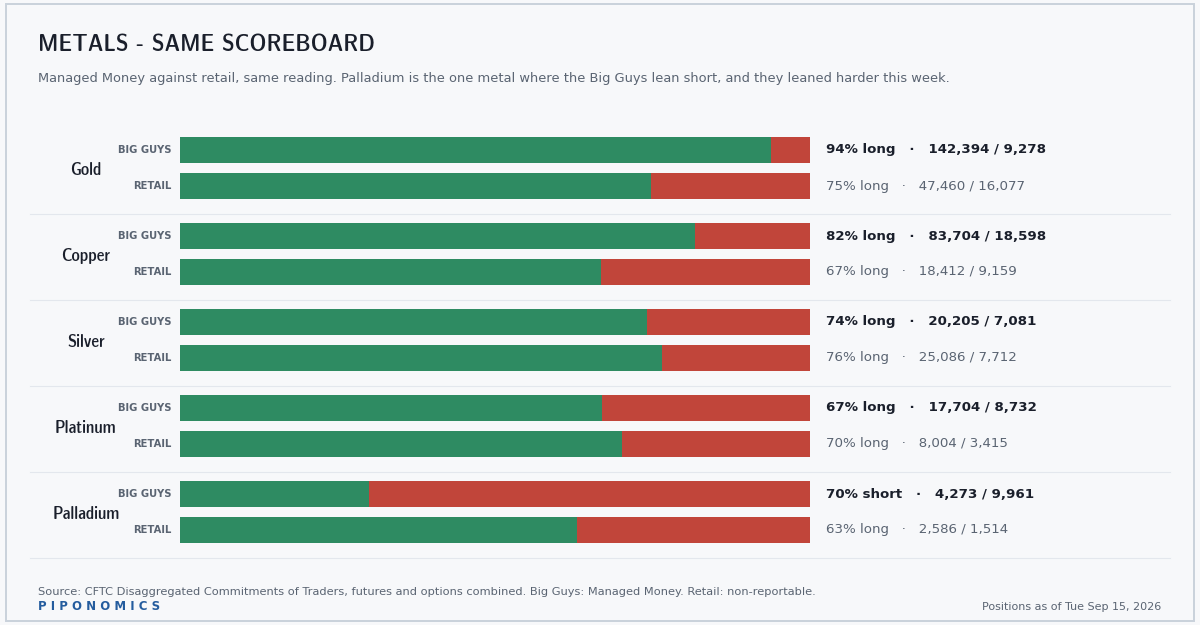
Gold 94% long. Managed Money is the CFTC’s label for the Big Guys in metals - same people, different form. Copper 82%, down from 86% after 14,303 longs were sold, the biggest metals move of the week.
Platinum 67% long. Palladium 70% short, the one metal where the Big Guys lean the other way, and they leaned harder.
Silver, the standing oddity: Retail holds 25,086 longs against the Big Guys’ 20,205. The small accounts own more of that market than the professionals do.
02 THE APPOINTMENT BOOK
What This Is: This section is about time, not price. We’re looking for dates when past market cycles, major historical anniversaries and current Gann counts bunch together, creating periods when a turn or unusually large move becomes more likely. Helps answer the question of ‘when’ something big could happen.
Three layers. First, each currency pair's own cycle. Then the broader historical calendar. Then the dates where both point to the same place.
This week, all three keep pointing toward Wednesday.
One Pair At A Time
Gann treated time like a circle. One full cycle = 360 degrees. Think of 90 degrees as roughly one-quarter of a cycle, 180 as half, 270 as three-quarters and 360 as the full thing.
Some markets here are counted in calendar days. Others use degrees of the yearly cycle. The count begins from a confirmed swing - a major high or low that price moved away from and later respected.
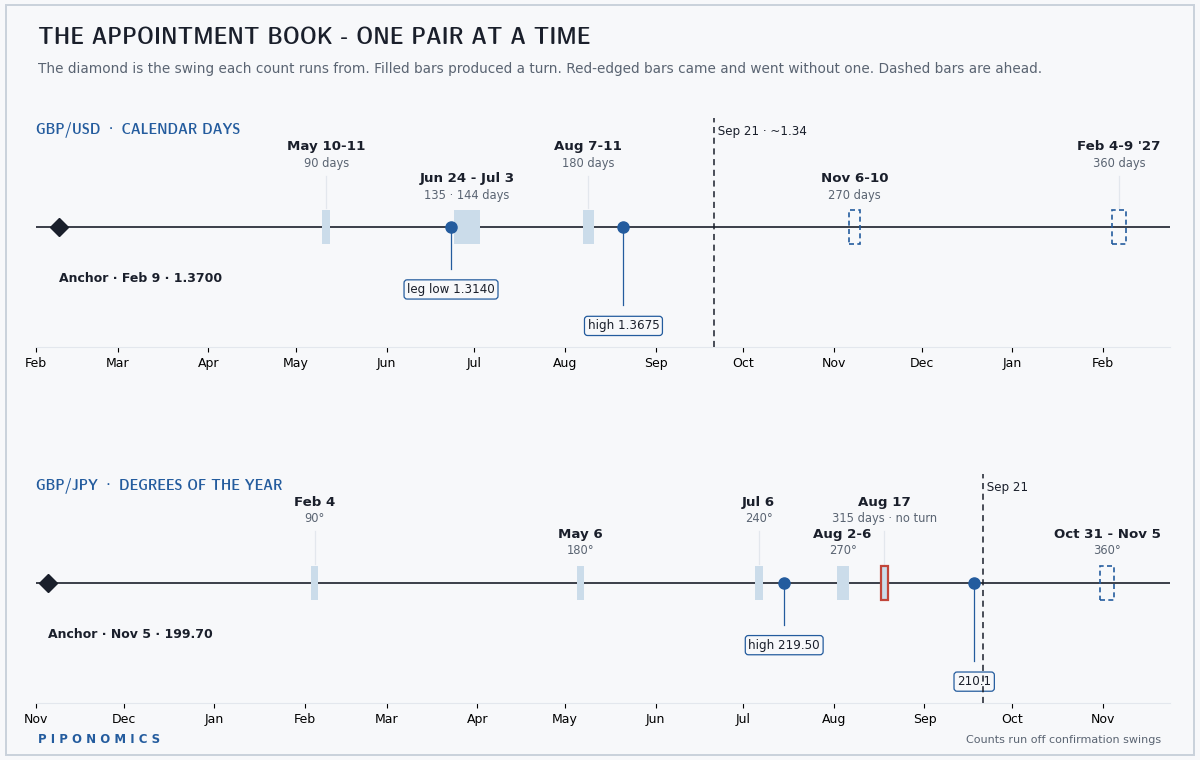
GBP/USD’s 180-day count in early August sits behind a low at 1.3287 and a run to 1.3675. Price is near 1.34 now, a six-week low, after the Fed hike.
GBP/JPY’s 315-day count on August 17 produced nothing and stays marked that way. The pair fell from 219.50 in July to 207.8 in early September and has bounced to 210.1.
Next: GBP/USD’s 240-degree count this Saturday, then the 270-day count November 6-10. GBP/JPY’s full year, October 31 to November 5.
Scar Tissue - The Whole Calendar
Markets remember dates. Or, more accurately, we are testing whether major historical events leave timing patterns that show up again later.
Crashes. Record highs. Record lows. Huge daily ranges. Giant weekend gaps. We track the anniversaries. Within this framework, certain recurring intervals get extra attention - squares, sevens and decades. That includes 4, 7, 9, 10, 16, 25, 28, 49, 50 years and similar counts.
We call those master years.
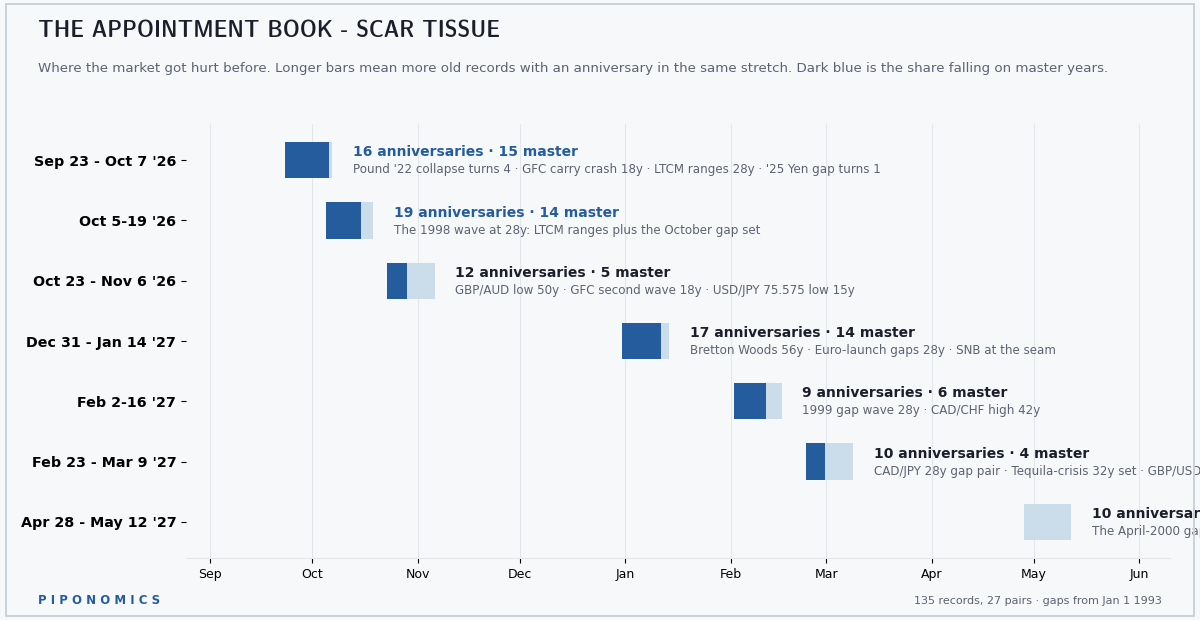
The database currently includes 135 all-time records across 27 currency pairs - highs, lows, record ranges and major weekend gaps.
The working rule is simple: Three anniversaries inside 15 days = a timing window.
The strongest windows contain about 1.7 times as many anniversaries as a random 15-day stretch from the same calendar. Roughly nine instead of five.
Where The Two Agree
This is the corridor. The corridor is a stretch of time where two separate timing methods independently point toward the same dates.
One method uses this year's confirmed swing counts. The other uses major historical anniversaries. Neither knows what the other one is doing. When both get near each other at once, we pay attention.
This year's day counts are built from 36 confirmed swing dates already set in 2026.
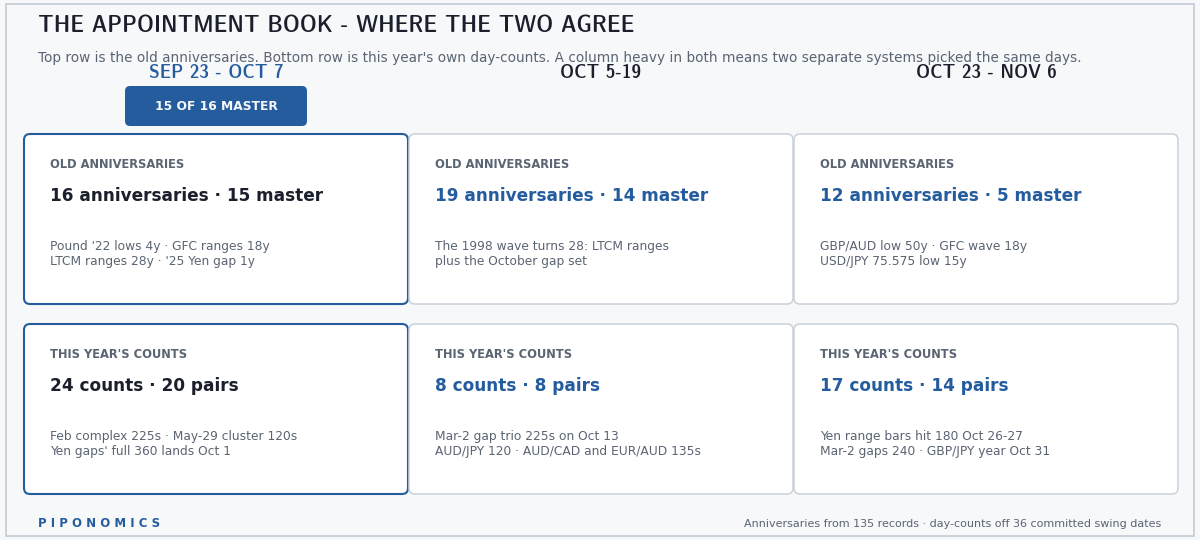
September 23 through October 19 is heavy in both systems.
That window opens Wednesday.
The 2022 Pound collapse, the 2008 carry crash and the 1998 Yen crisis all hit master-year anniversaries during the stretch. Meanwhile, more than 24 current day counts from 20 currency pairs land inside it.
The Kiwi crowd just abandoned its trade. And the dollar sits at a seven-week high. Plenty of fuel. We will find out whether anybody lights it.
03 PRICE AND TIME
What This Is: Gann’s Square of Nine (and other tools) turn a major high or low into mathematically related price levels. We’re testing whether those levels behave like support or resistance, and whether they become more important when price reaches them near a Gann time count.
The Running Record
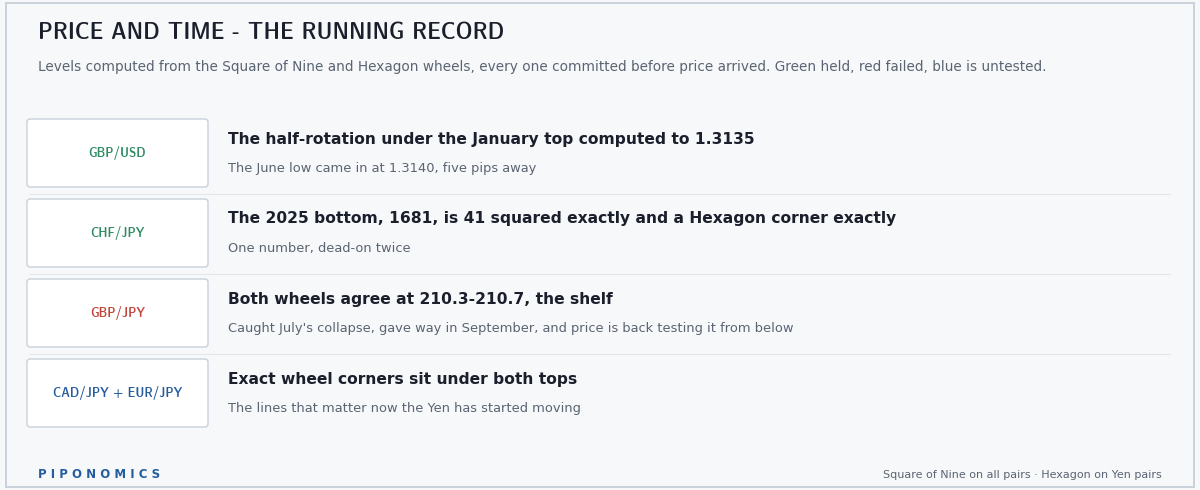
GBP/JPY is the line to watch this week. Both Gann wheels landed within a point of each other at 210.3-210.7. July’s fall from 219.50 stopped there and bounced 500 pips. September went straight through it to 207.8. Friday’s close at 210.13 puts price right underneath it, testing from below. A level that was support and then failed is being asked whether it works as resistance.
Dates And Levels
The strongest setup is when price reaches a calculated level near the calculated date.
That is when price and time meet. If price hits the level early, the level still matters. If the date arrives without price reaching the level, the date can still act as a turn window.
But when both arrive together, pay close attention.
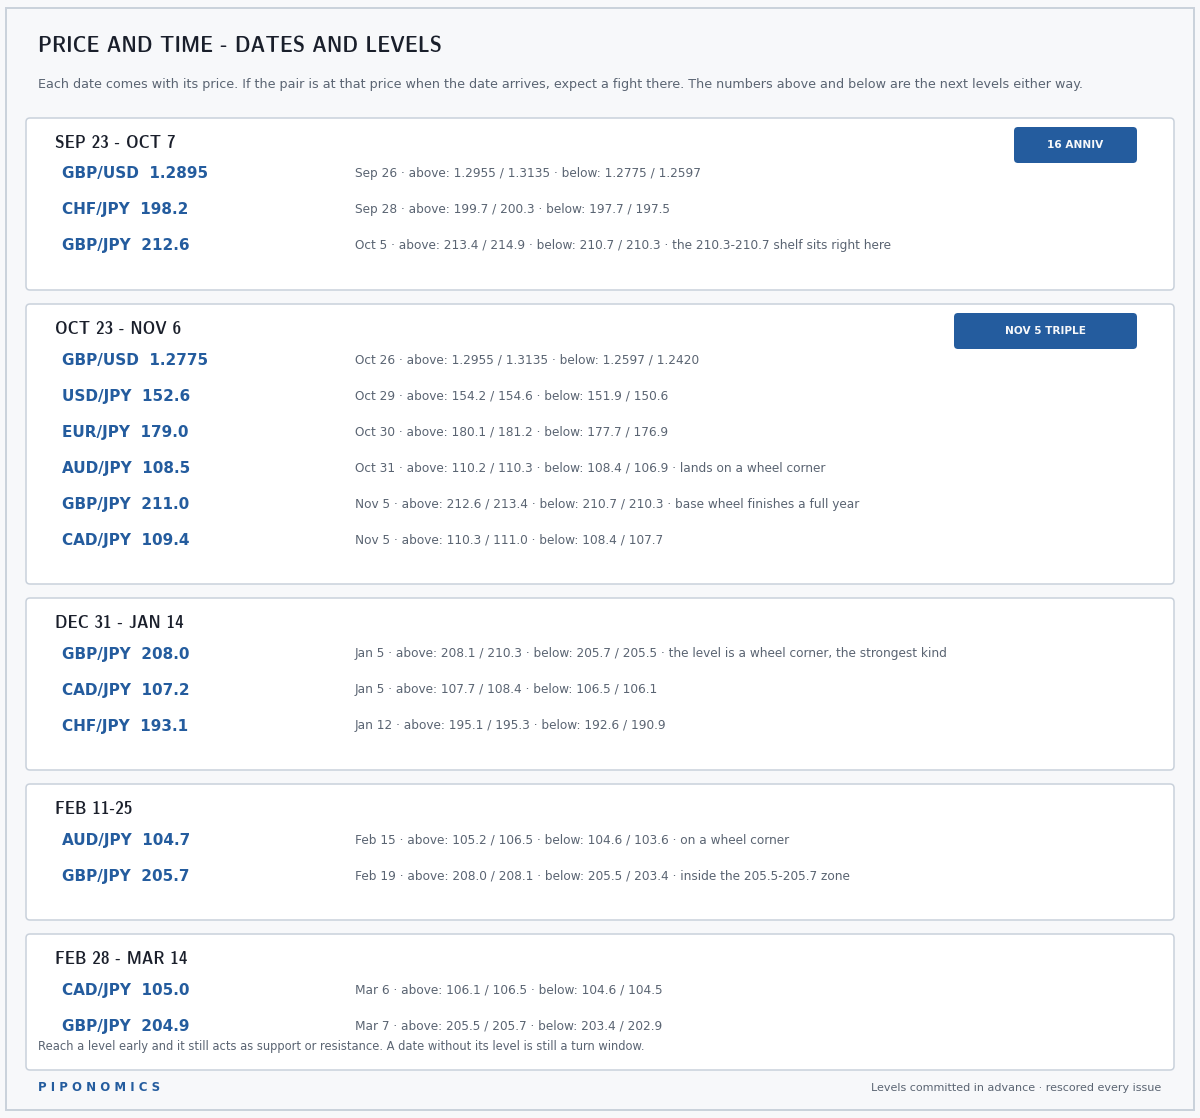
Price at the listed level on its date - expect a fight. At the level early - still a level. On the date without the level - still a turn window.
September 26, GBP/USD at 1.3455. The 240-degree count off the January top lands Saturday, and price is about 60 pips beneath the level. The first date-and-level pairing inside the corridor.
October 5, GBP/JPY at 212.6, with the shelf directly beneath it.
04 MONEY WHERE THE MOUTH IS
What This Is: The charts. Every idea carries the level that proves it wrong. Weekly, scored from next issue.
USD/JPY - topside, with a lid. The Big Guys flipped to 56% long the Yen the day before the Fed, and the Yen fell 330 pips through two rate hikes. A crowd that is wrong on entry does not usually get patient; it gets stopped.
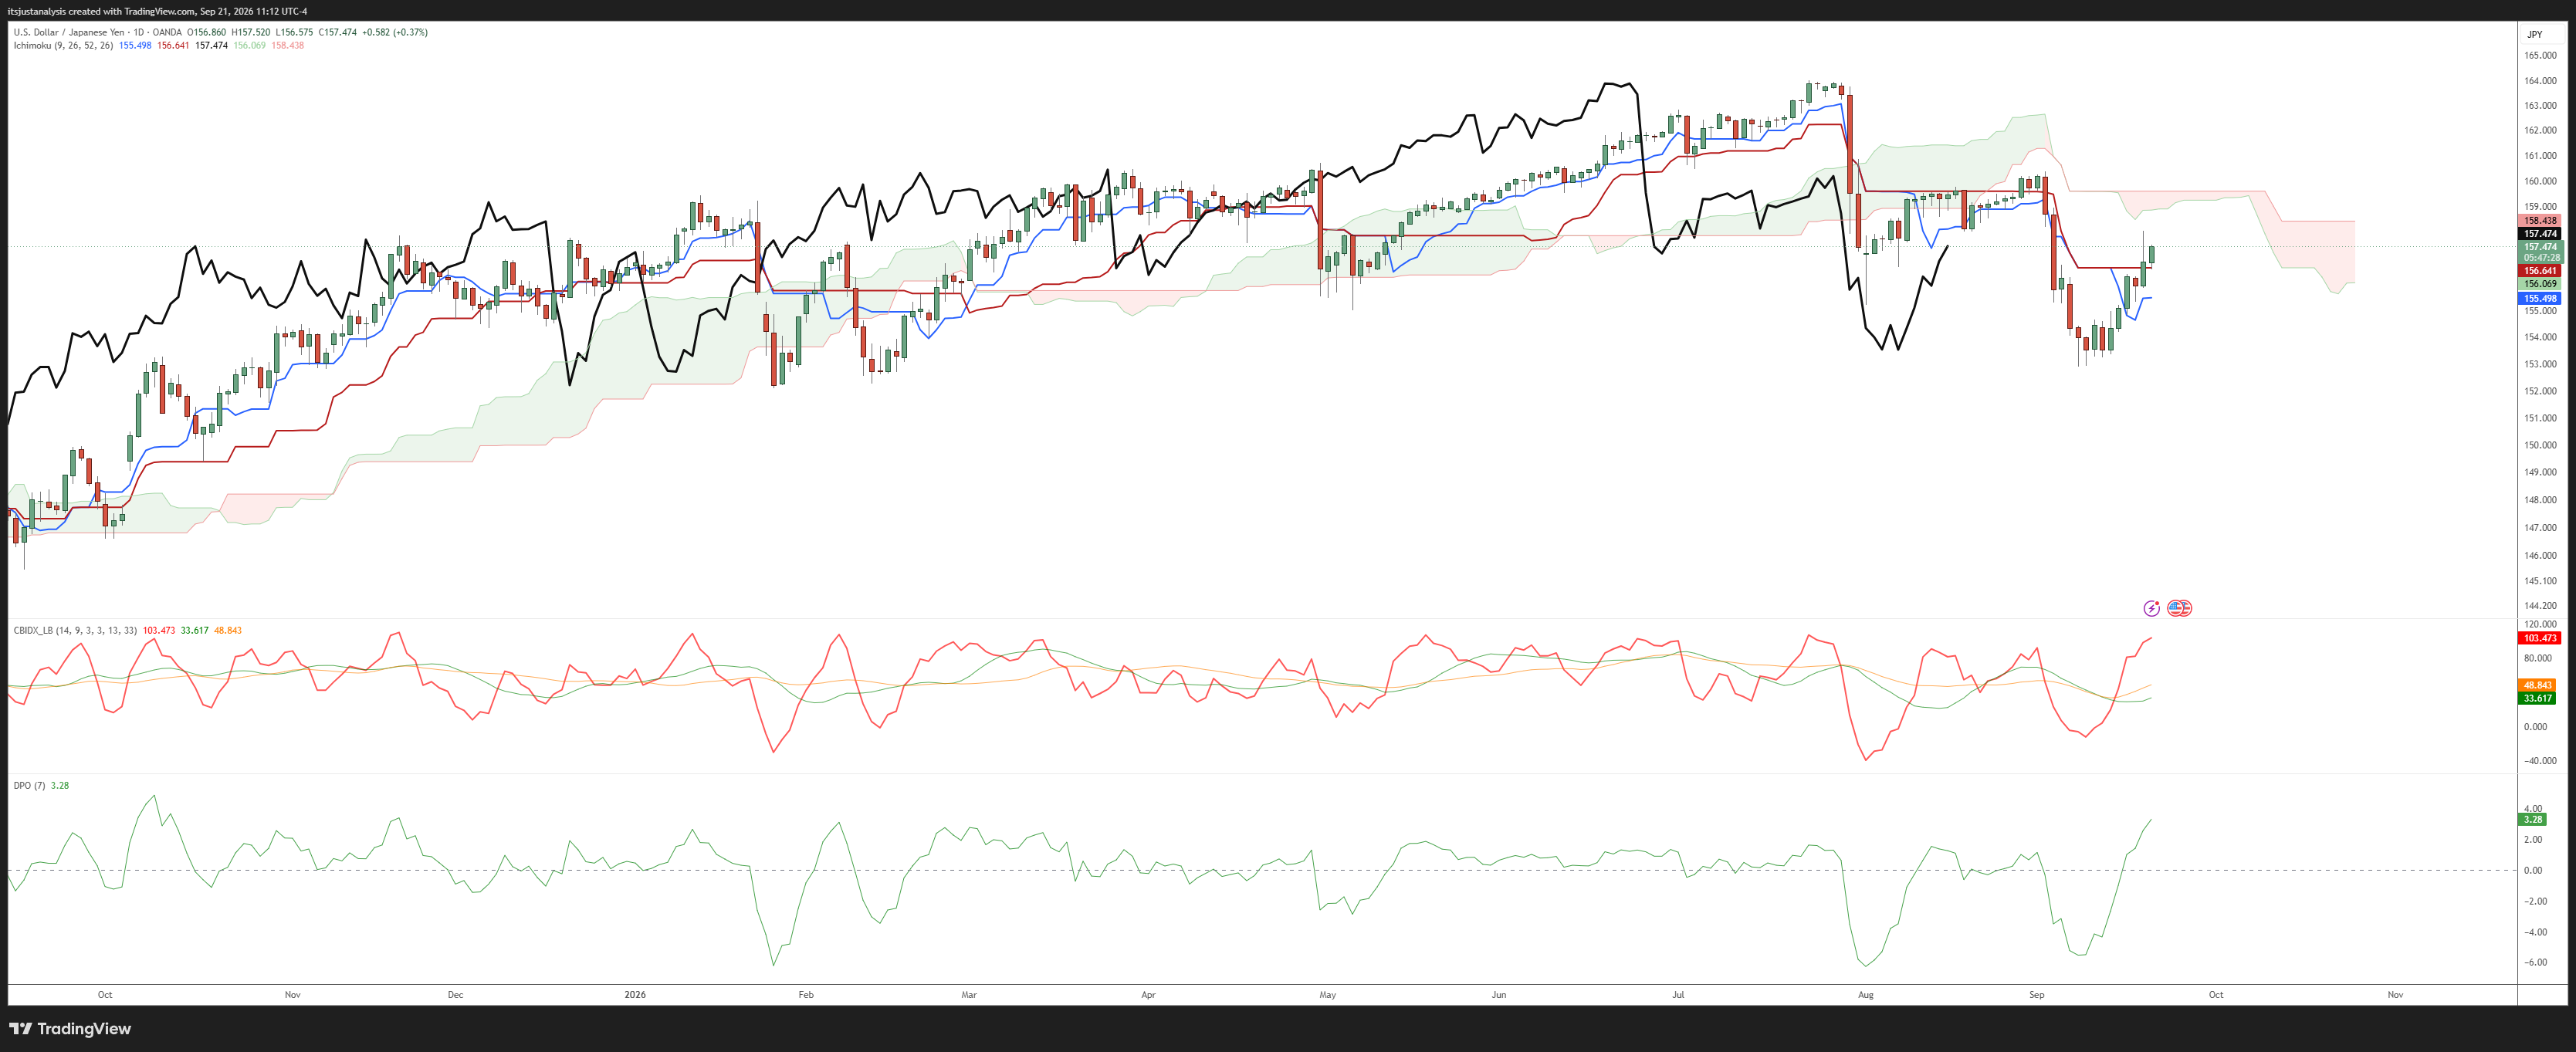
The daily is below the Cloud, but the Cloud is thin, and thin Clouds are a sign of weakness - it is easier for price to move through them and close on the other side.
The daily Composite Index is at historical resistance.
Watch the Chikou Span - Ichimoku’s lagging line, today’s close plotted 26 bars back. It has the candlestick bodies, the Tenkan-Sen and the bottom of the Cloud all stacked in the 158 to 158.9 area as resistance. That is the lid on the bounce.
The new major high to pay attention to is 163.98, made July 23, 2026 - a level not seen since December 1986.
Friday’s positioning data will show whether the crowd has already started leaving, and the chart says the squeeze runs into a wall in the 158 to 159 zone. Wrong if USD/JPY closes back below 153.24.
GBP/USD - downside. Near 1.34, a six-week low, through the floor of the 1.3450-1.3600 range it held for a month.
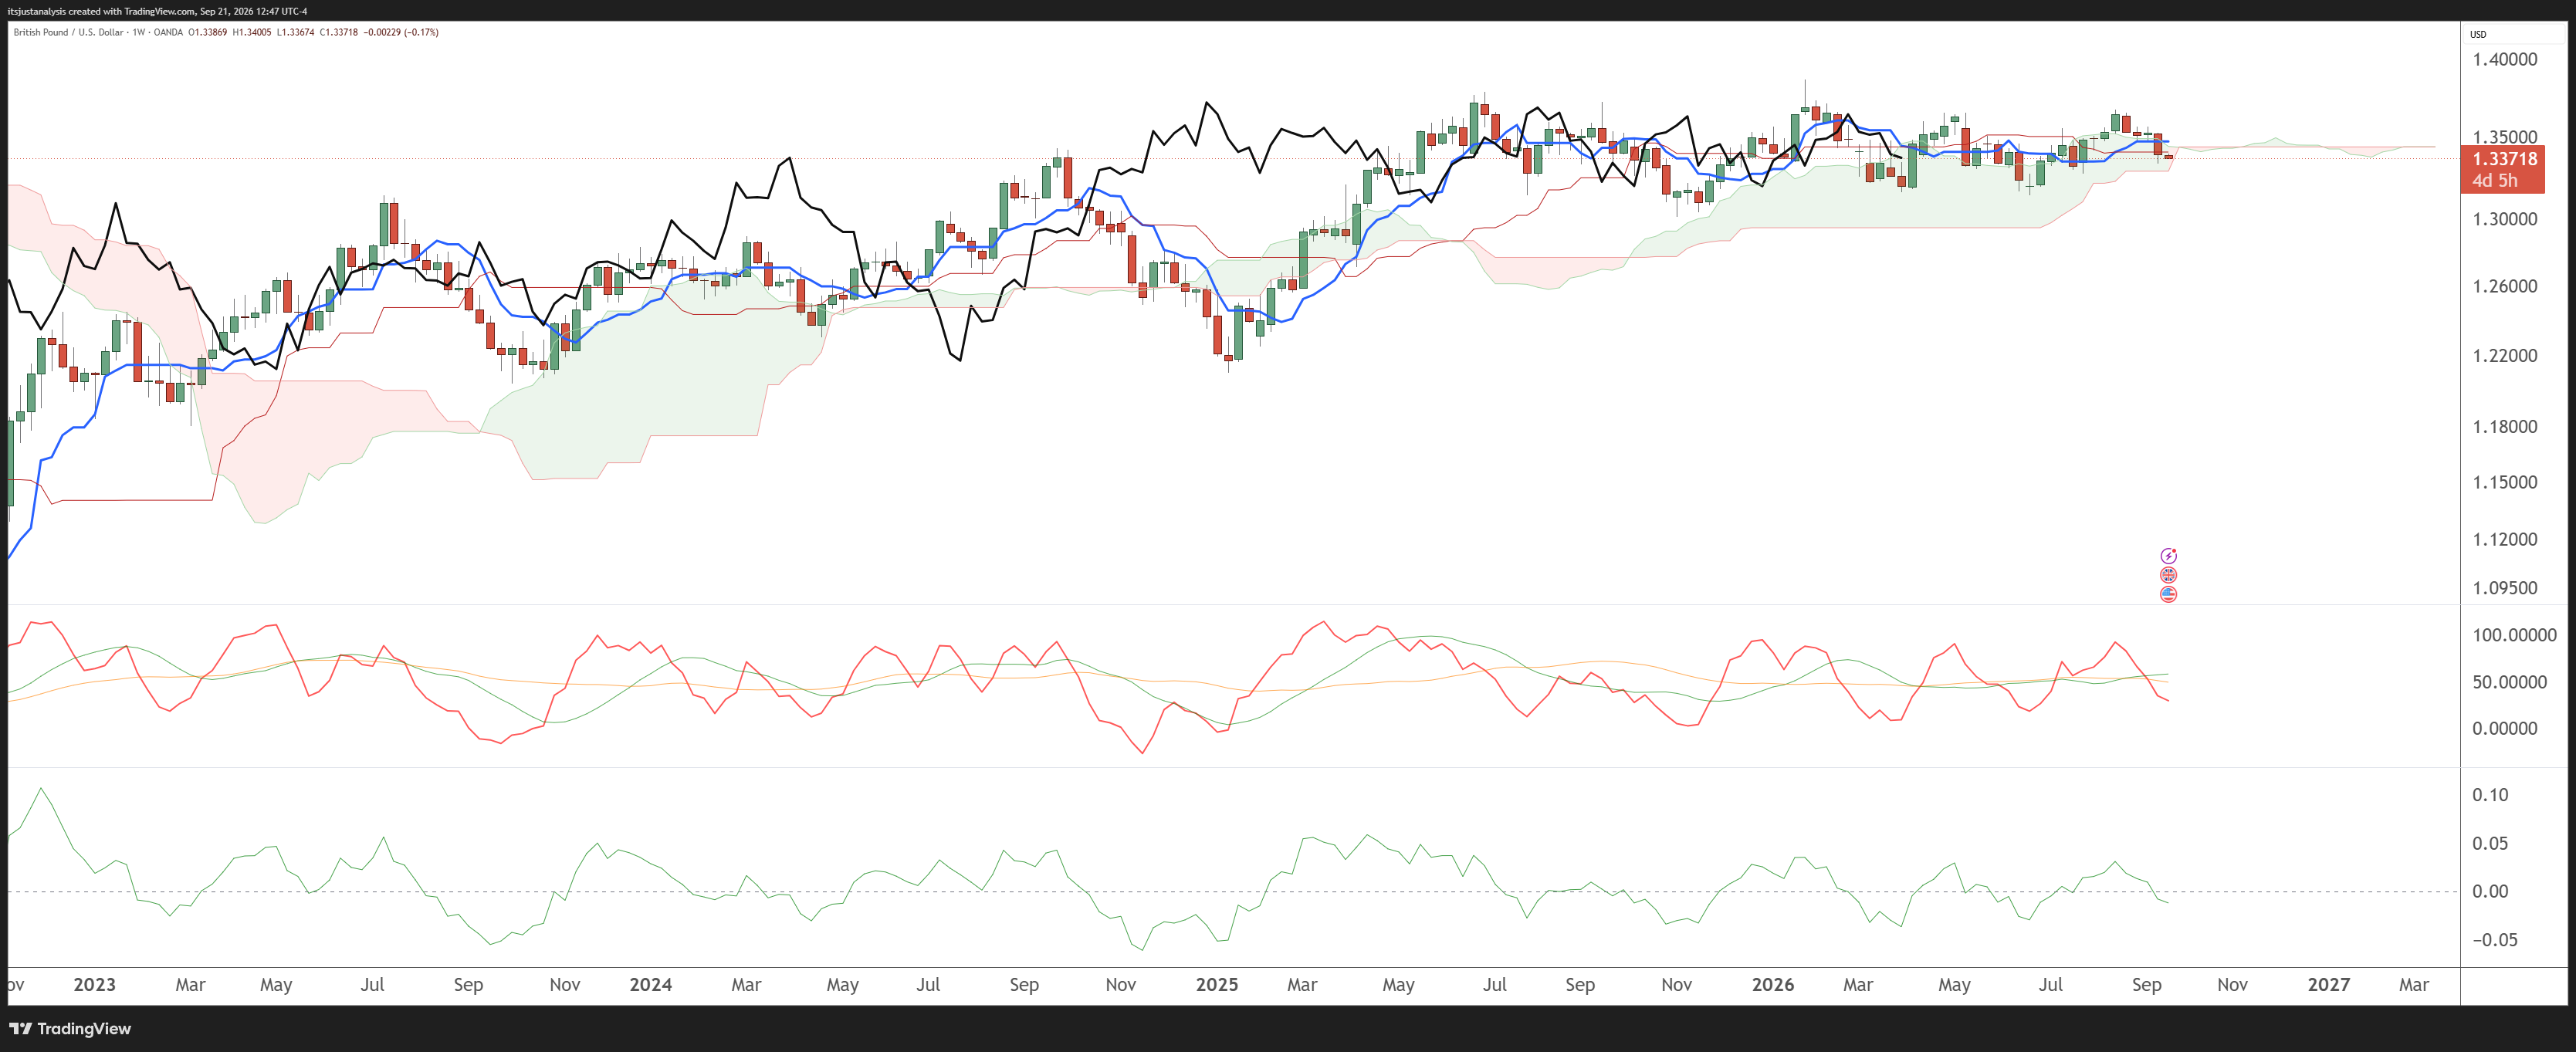
The Fed hiked, the dollar is at a seven-week high, and the Big Guys added 10,404 Pound shorts into it. Saturday’s 240-degree count sits at 1.3455, sixty pips overhead, and a level that close can catch a bounce. Wrong if the weekly close is back above 1.3455.
EUR/USD - no position, and the waiting room just emptied. The weekly opened below the Cloud for the first time since March 2025.
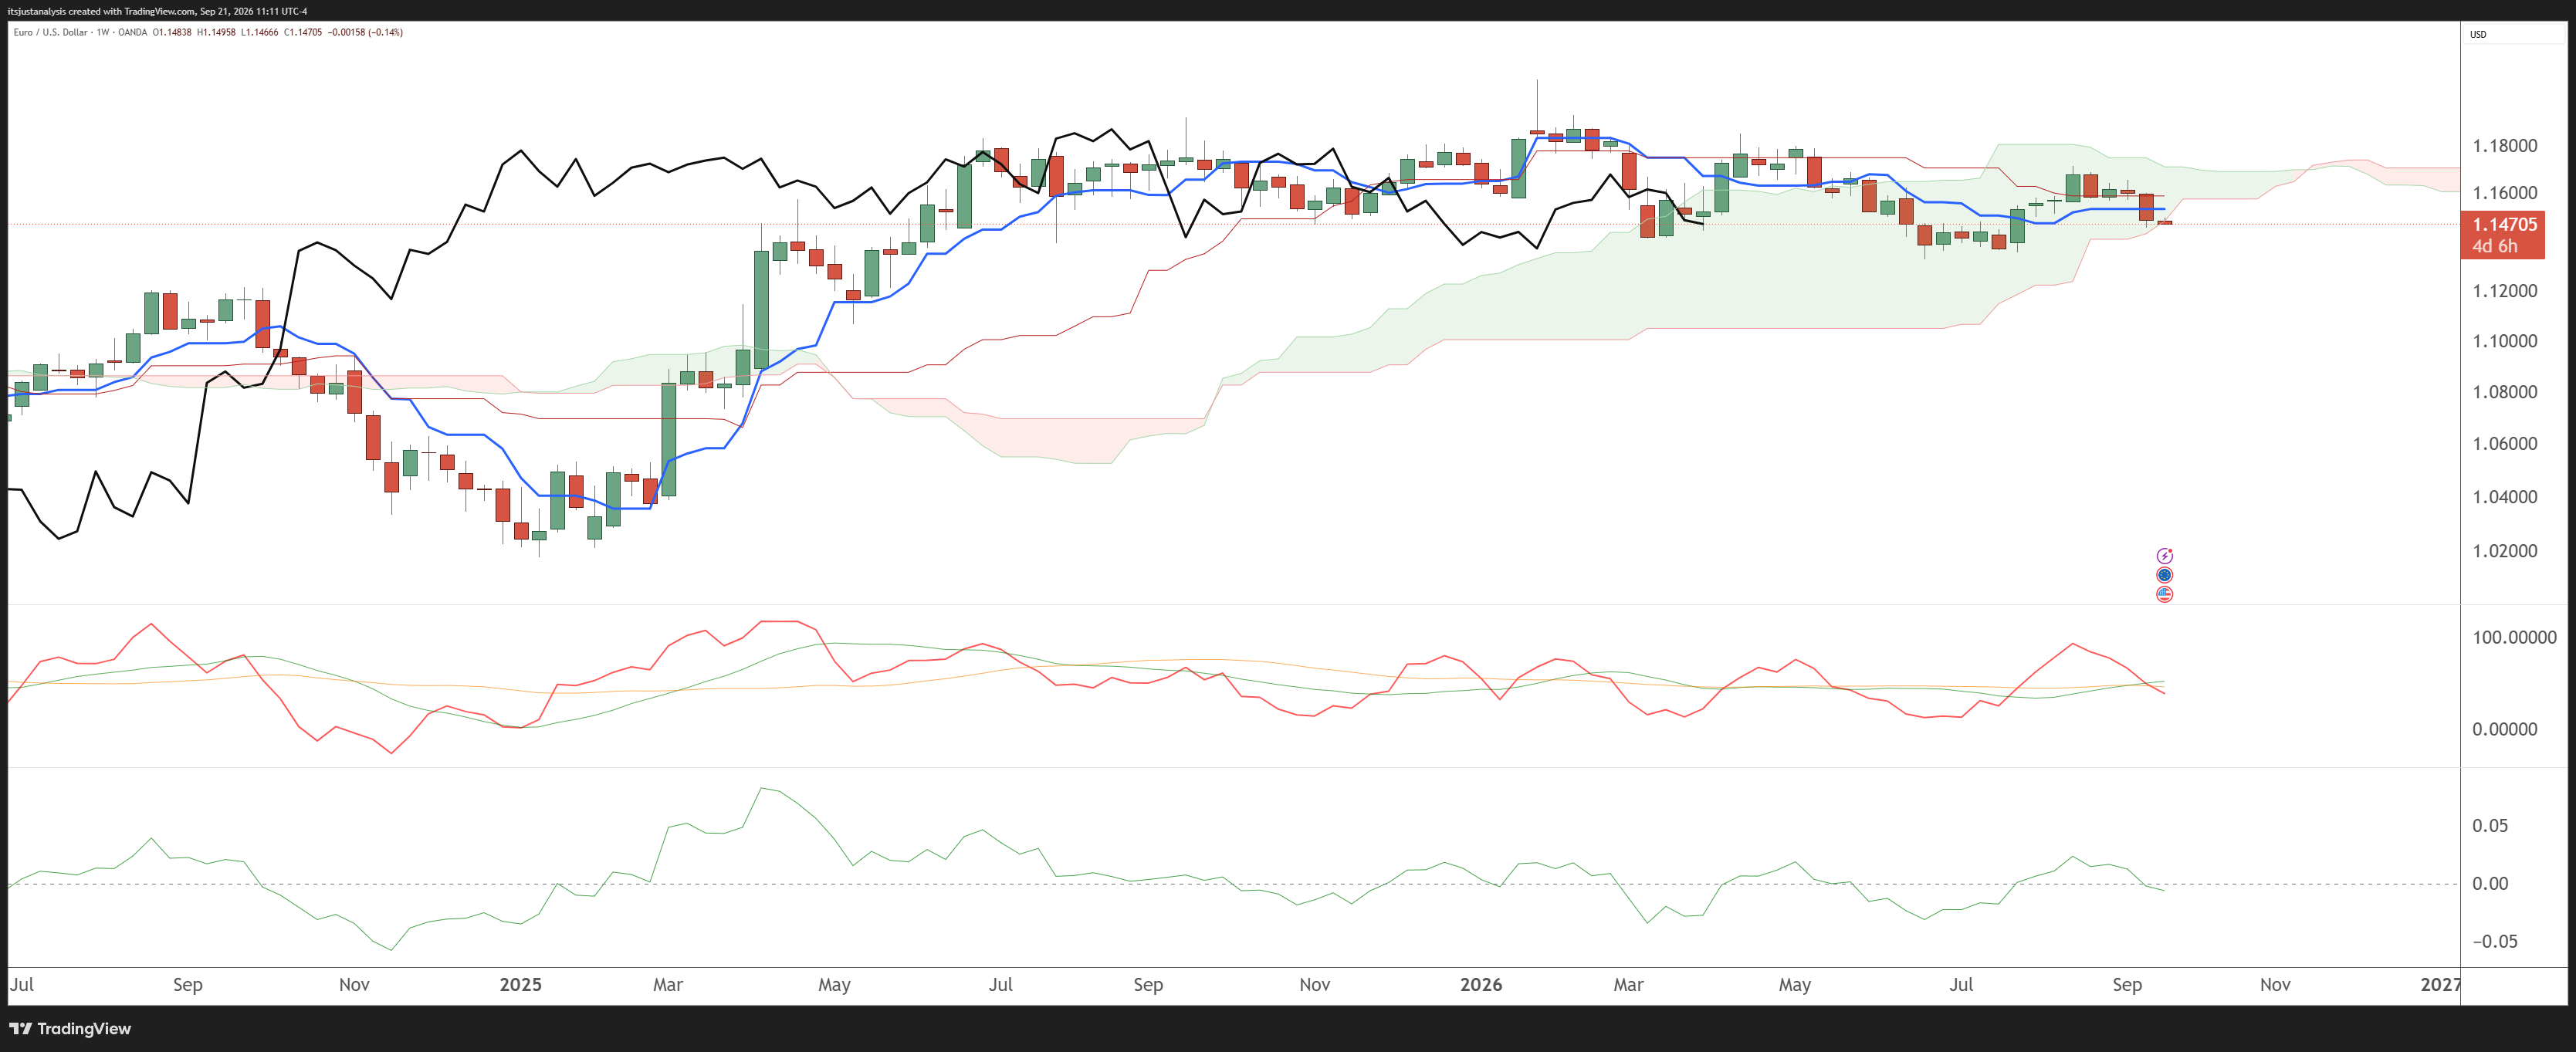
The bottom of the Cloud, Senkou Span B at 1.1482, is the key support zone. Price is 1.1470, sitting on it. If it fails, look out below.
The Composite Index is doing the pinch - crossing and closing through both of its averages in the same bar - and the Detrended Price Oscillator is showing signs it will close below the zero line.
Watched until Friday’s weekly close. A close under 1.1482 turns this into a downside idea, inside the corridor, on the first week under the Cloud in eighteen months.
GBP/JPY - no position, at the line, with the monthly rolling over. 210.13 against a shelf at 210.3-210.7 that caught July and failed in September.
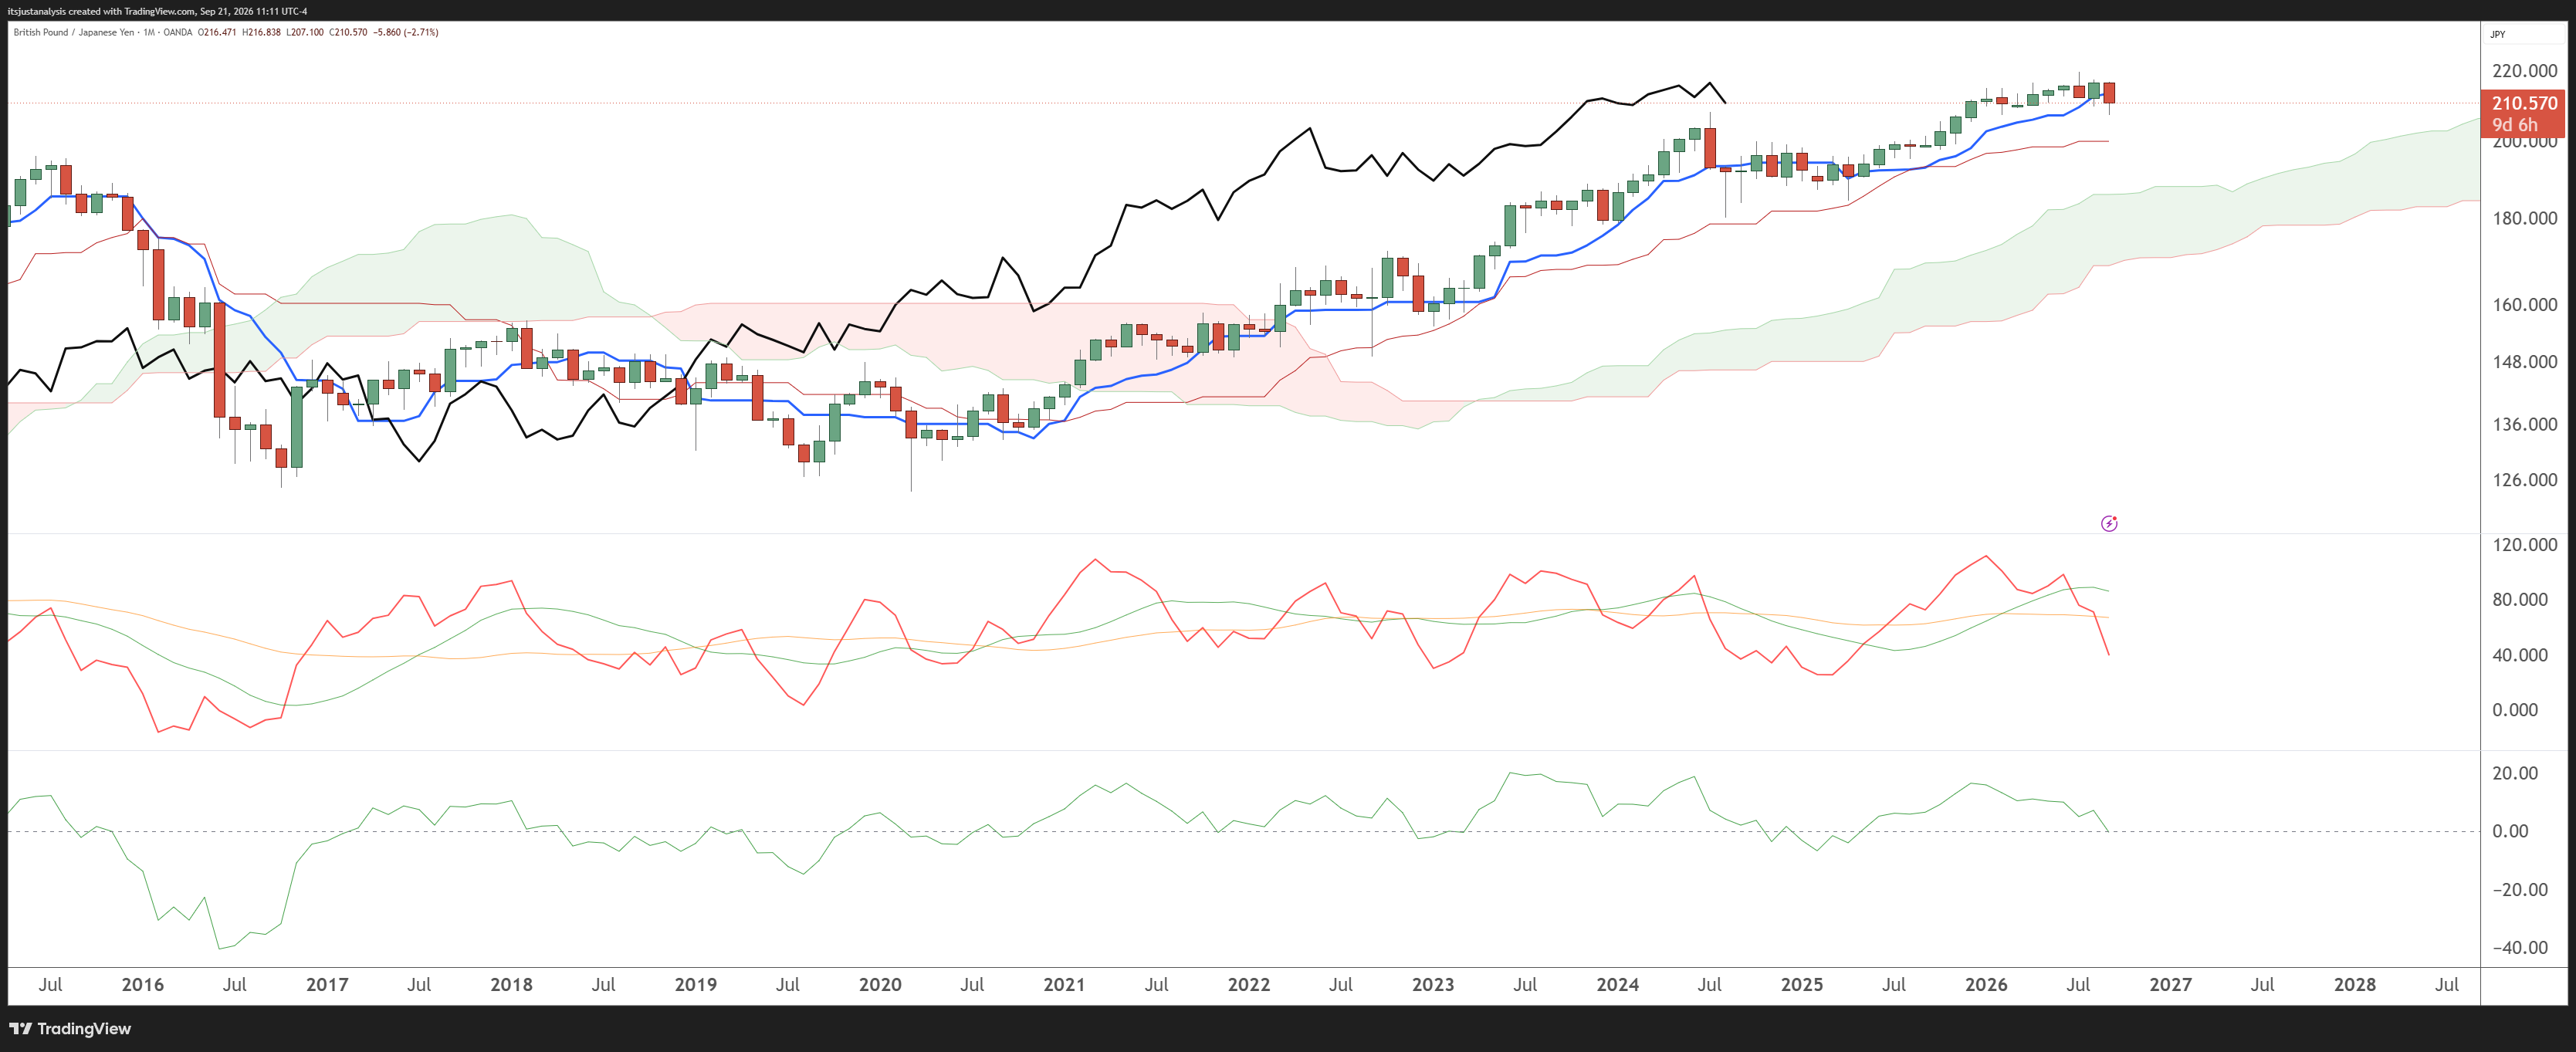
Watch this one. On the monthly the Composite Index has already dropped below both of its moving averages, and the Detrended Price Oscillator looks positioned to cross below the zero line. If that happens, look out below.
The monthly close is Wednesday the 30th, inside the corridor. Watched until then. A monthly DPO close below zero with the shelf holding as resistance is the downside trigger, and the October 5 count at 212.6 is the level it has to fail under.
EUR/JPY - same read as GBP/JPY, more pronounced and more apparent. 180.64, down 2.66% on the month so far.
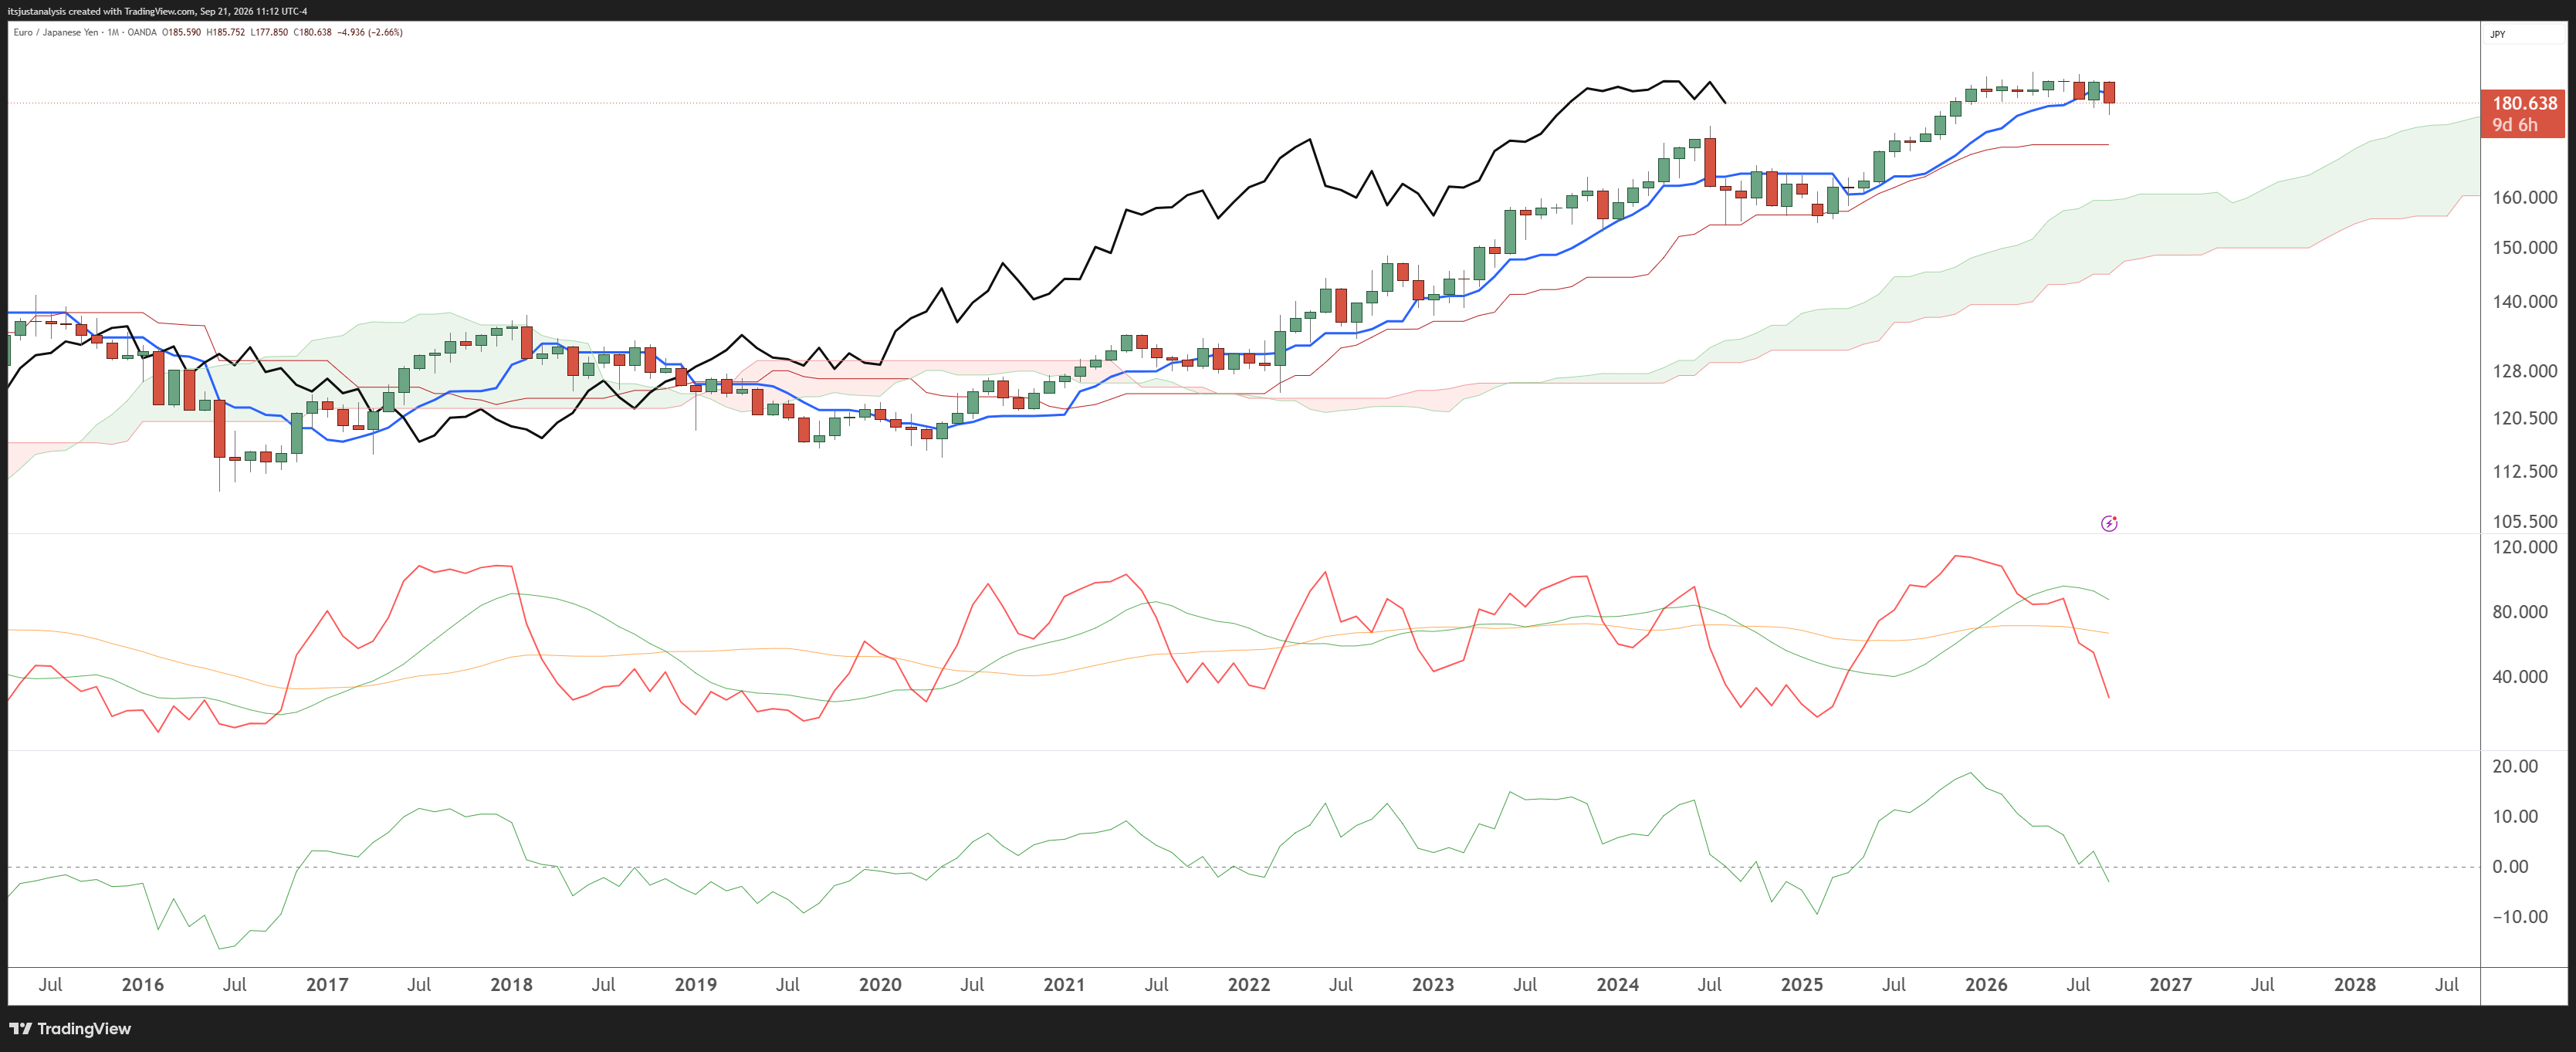
The monthly Composite Index has fallen through both of its averages, harder and further than GBP/JPY’s, and the DPO is already sitting on the zero line.
Of the two, this is the cleaner chart and the one to watch first at Wednesday’s close.
NZD/JPY - nothing. The weekly is inside the Cloud. Stay away, and not politely.
AUD/USD - nothing yet. The Big Guys are 74% long and still adding. The crowd is the reason to wait rather than chase.
05 THE WEEK AHEAD
What This Is: This is the calendar for everything above. These are the dates when positioning data, Gann counts, major price levels and historical timing windows are due to collide, so you know what matters before price gets there.
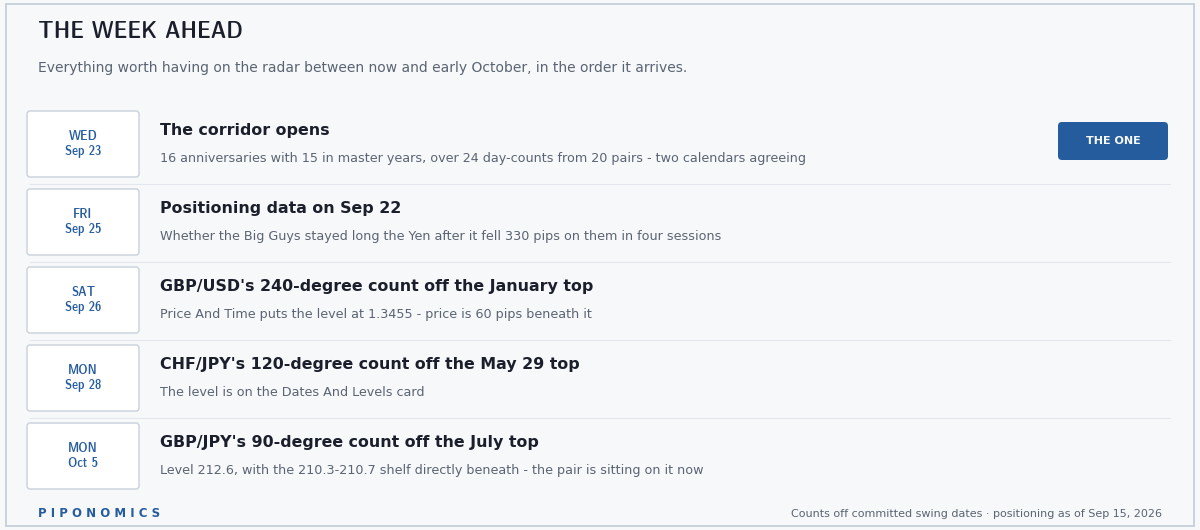
Wednesday September 23. The corridor opens - sixteen anniversaries, fifteen in master years, over 24 day-counts from 20 pairs. Two calendars agreeing on the same stretch of days.
Friday September 25. Positioning data on September 22 - whether the Big Guys stayed long a Yen that fell 330 pips on them in four sessions.
Saturday September 26. GBP/USD’s 240-degree count lands at 1.3455, with price sixty pips beneath it. The first date-and-level pairing inside the corridor.
Monday September 28. CHF/JPY’s 120-degree count off the May 29 top.
Monday October 5. GBP/JPY’s 90-degree count at 212.6, with the 210.3-210.7 shelf directly beneath. That is the level the pair is sitting on now.
Terms & Conditions 📝
Securities Disclaimer: STOCKTWITS IS NOT A TAX ADVISOR, BROKER, FINANCIAL ADVISOR OR INVESTMENT ADVISOR. THE SERVICE IS NOT INTENDED TO PROVIDE TAX, LEGAL, FINANCIAL OR INVESTMENT ADVICE, AND NOTHING ON THE SERVICE SHOULD BE CONSTRUED AS AN OFFER TO SELL, A SOLICITATION OF AN OFFER TO BUY, OR A RECOMMENDATION FOR ANY SECURITY. Trading in such securities can result in immediate and substantial losses of the capital invested. You should only invest risk capital, and not capital required for other purposes. You alone are solely responsible for determining whether any investment, security or strategy, or any other product or service, is appropriate or suitable for you based on your investment objectives and personal and financial situation. You should also consult an attorney or tax professional regarding your specific legal or tax situation. The Content is to be used for informational and entertainment purposes only and the Service does not provide investment advice for any individual. Stocktwits, its affiliates and partners specifically disclaim any and all liability or loss arising out of any action taken in reliance on Content, including but not limited to market value or other loss on the sale or purchase of any company, property, product, service, security, instrument, or any other matter. You understand that an investment in any security is subject to a number of risks, and that discussions of any security published on the Service will not contain a list or description of relevant risk factors. In addition, please note that some of the stocks about which Content is published on the Service have a low market capitalization and/or insufficient public float. Such stocks are subject to more risk than stocks of larger companies, including greater volatility, lower liquidity and less publicly available information. Read the full terms & conditions here. 🔍