
PIPONOMICS · ISSUE 02 · MONDAY, SEPTEMBER 28, 2026 · COT AS OF SEP 22
GBP/USD broke its July low. EUR/USD finished the week below the support level we were waiting on. Both downside ideas are now active.
USD/JPY’s bounce reached resistance, so that upside idea is closed. The next decision comes Wednesday, September 30: GBP/JPY and EUR/JPY need their bearish monthly signals to survive the close before either becomes an active downside idea.
Last week’s GBP/USD date-and-price call missed. September 26 arrived. Price never reached 1.3455. It was busy going the other way.
A few translations before we start: A level is a price to watch. A count identifies a date from the cycle calculations. A window groups several dates together. The calendar tells me when to pay attention.
01 THE LEDGER
What this shows: Last week’s levels, dates, positioning calls, and setup ideas checked against what happened. Misses, hits, and unfinished business.
Issue 1: 6 hits, 1 miss, 1 pending, 1 open. These are results for different kinds of calls. A resistance test, a condition activating, and a correct decision to stay out each get labeled for what they were.
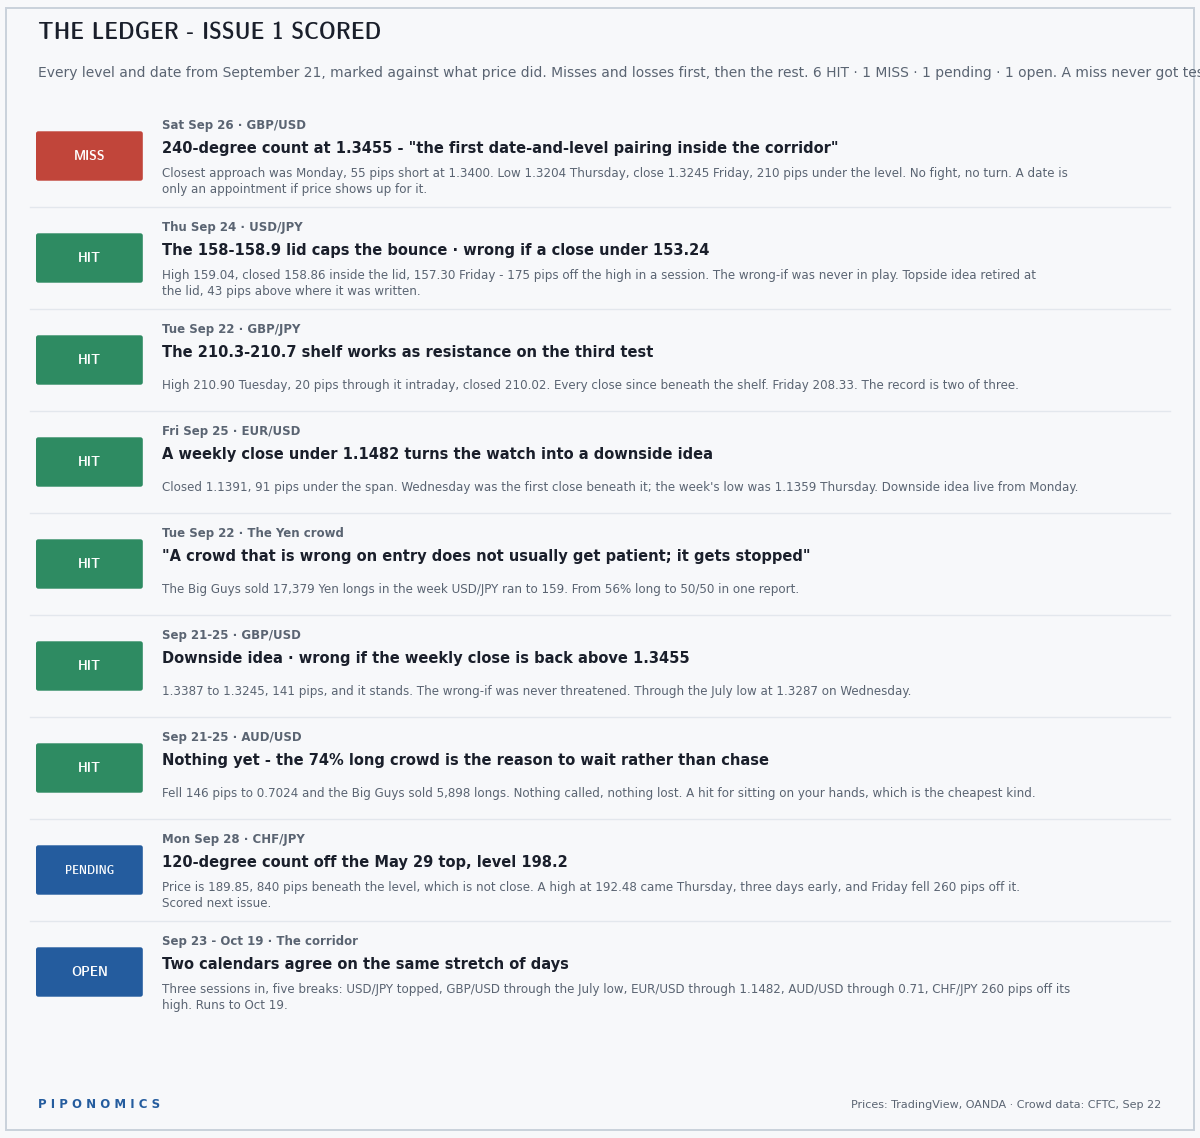
MISS - GBP/USD date-and-price test. September 26 / 1.3455. September 26 was the date to watch for a turn. The corresponding price level was 1.3455. Price never reached it. Monday’s high at 1.3400 was the closest approach, 55 pips short. The pair then fell to 1.3204 and finished Friday at 1.3245, 210 pips below the level. No fight, no turn. A date is only an appointment if price shows up for it, and price was busy going the other way.
HIT - USD/JPY resistance test. September 24 / 158.0-158.9. Thursday’s high briefly pushed above the resistance band to 159.04. The close at 158.86 was back inside it. Friday finished at 157.30, 174 pips below Thursday’s high. The upside idea is closed at resistance. Its original invalidation level at 153.24 was never threatened.
HIT - GBP/JPY resistance test. September 22 / 210.3-210.7. Tuesday’s high reached 210.90, 20 pips above the resistance zone. The close was back underneath at 210.02. Every subsequent close stayed below the zone, and Friday finished at 208.33. Two of the three tracked tests have respected this area. Its job has changed from support to resistance.
HIT - EUR/USD setup condition confirmed. September 25 / weekly close below 1.1482. Friday closed at 1.1391, 91 pips below the level. That confirmed the first weekly close beneath the Ichimoku Cloud since March 2025. The condition was met. The downside idea becomes active Monday, September 28.
HIT - Yen positioning call. September 22 report. The Big Guys reduced their yen longs by 17,379 contracts. Their long share fell from 56% to an even long/short split. The net-long bias disappeared. The long positions did not.
HIT - GBP/USD directional call. September 21-25. The pair fell from Monday’s open at 1.3387 to Friday’s close at 1.3245, a 142-pip move from that reference price. It broke the July low at 1.3287 on Wednesday. The downside idea remains active. Last week’s wrong-if, a weekly close above 1.3455, was never challenged. This week’s tighter invalidation level is in the chart section.
HIT - AUD/USD decision to wait. September 21-25. The crowded long position was the reason not to chase. AUD/USD fell 146 pips to 0.7024, while the positioning report showed 5,898 fewer professional longs. A hit for sitting on your hands, which is the cheapest kind.
PENDING - CHF/JPY timing review. September 28 / corresponding level at 198.2. Friday’s price was 189.85, putting the calculated level 835 pips overhead. Thursday’s high at 192.48 came four calendar days before today’s date. By Friday’s close, the pair was 263 pips below that high.
Two separate observations: the 198.2 price level has not been tested, and Thursday’s high remains under review as a possible early turn. The timing result stays pending until Friday, October 2.
OPEN - September 23-October 19 watch period. The first three sessions brought a USD/JPY top, breaks of support in GBP/USD, EUR/USD, and AUD/USD, and a sharp retreat from CHF/JPY’s high. The watch period remains open through October 19.
02 THE PILE-UP
What this shows: Where speculative positioning is crowded, and how it changed in the latest report.
The Big Guys are the professional speculative group shown here, including hedge funds and CTAs. Retail is the small-account category beneath them. Asset managers are excluded from this comparison.
Each percentage splits one group’s own long and short positions. A 75% long reading means 75% of that group’s plotted long-plus-short positions are long. It does not mean 75% of hedge funds are bullish. "Was" means the prior week.
One FX translation matters here: yen positioning describes the yen. USD/JPY runs the other way. A rising USD/JPY means the dollar is strengthening against the yen.
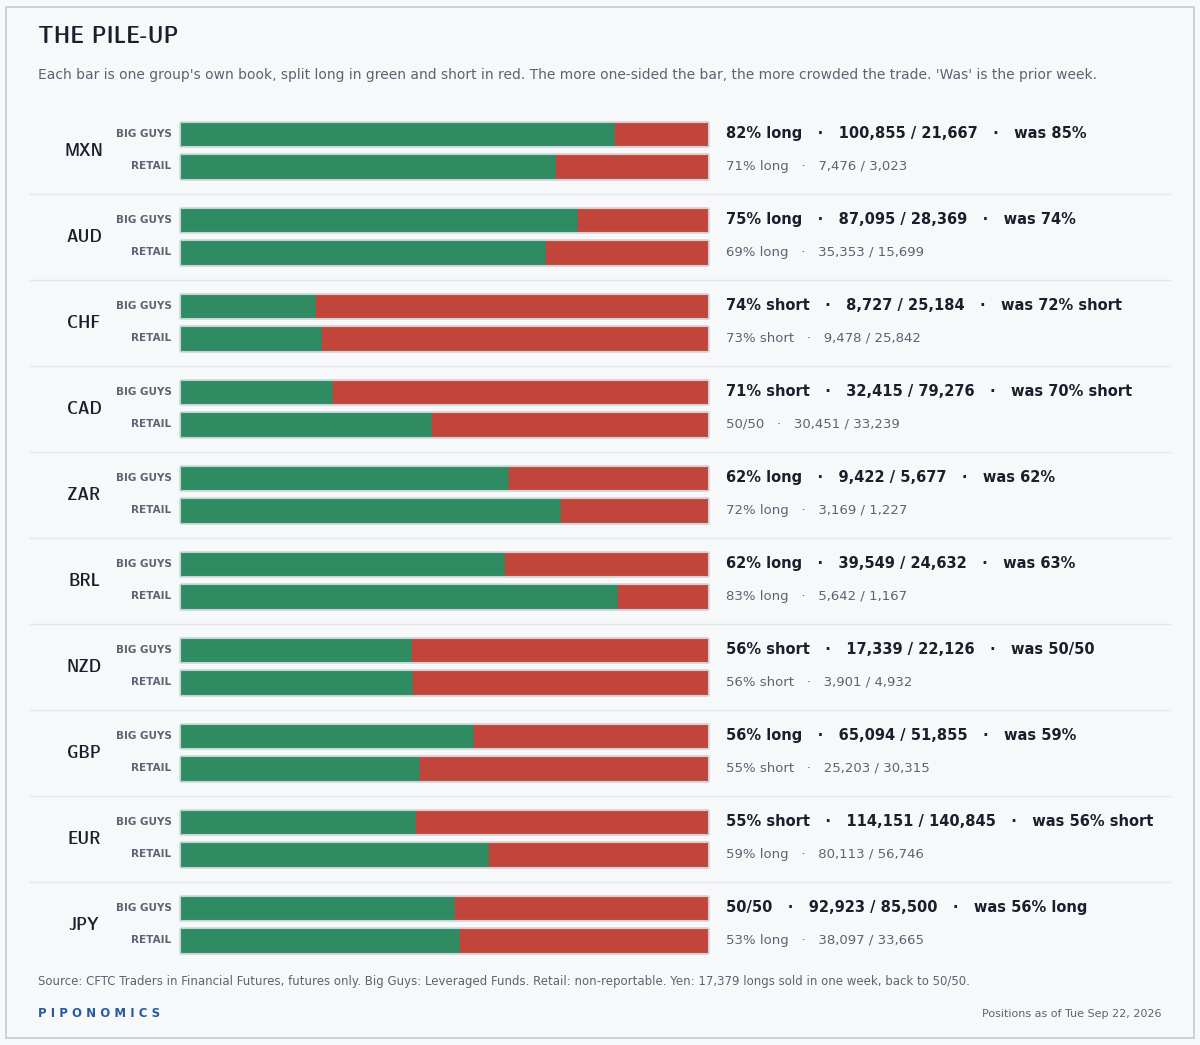
Yen: 50/50. A week earlier, the Big Guys were 56% long. The week before that, they were 62% short. Then they cut 17,379 longs. Three reports. Three very different positions. That reads less like conviction and more like a stop-loss with a filing requirement.
Peso: 82% long, down from 85%. Funds cut 8,796 longs. The most crowded currency position on the board finally saw some meaningful selling. Still the most crowded currency position on the board.
Aussie: 75% long after a 146-pip decline. The Big Guys cut 5,898 longs and covered 3,489 shorts. Both sides shrank, but the remaining position became more heavily long. The percentage rose. The long position did not. Three-quarters long into a falling market is Wile E. Coyote six feet past the edge of the cliff, legs still going. The looking-down is the part the Ledger will score.
Franc: 74% short.
Loonie: 71% short. Funds added 10,397 shorts a week after covering 15,510. The Loonie crowd runs on the Memento system: wakes up every Tuesday with a fresh tattoo that says the opposite of last week’s.
Kiwi: 56% short. Funds added 3,118 shorts. Six weeks ago, they were 91% short. Last week, they were balanced. Now they are leaning short again.
Pound: 56% long. Despite that overall long bias, funds added 6,742 shorts in the report preceding the break of July’s low.
Euro: 55% short. Funds added 10,891 longs and 9,429 shorts in the same week.
Metals - Same Scoreboard
For metals, the professional category is called Managed Money.
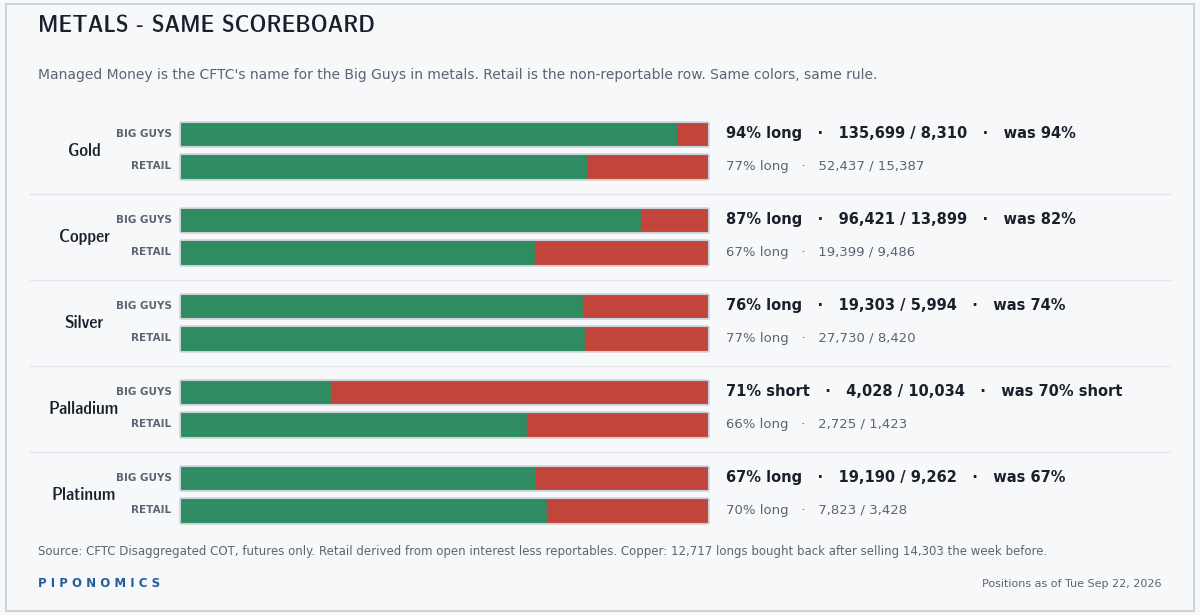
Gold: 94% long. Managed Money cut 6,695 longs and the long share was still 94%. There were very few shorts in the comparison to begin with. Last two minutes of Dodgeball. One guy left on the other side of the line, and everybody over here has a tired arm.
Copper: 87% long. Funds added back 12,717 longs after cutting 14,303 the previous week.
Silver remains the oddity. The small-account category holds 27,730 long contracts against Managed Money’s 19,303. That is more long contracts in the smaller-account row, not a claim that retail owns more of the entire silver market. The interns have the larger long position. Nobody seems especially concerned.
Platinum: 67% long. Palladium: 71% short. Palladium remains the metal leaning the other way.
03 THE APPOINTMENT BOOK
What this shows: Dates my cycle work flags for possible turns. These are watch dates, not automatic entries or forecasts of direction.
There are two calendars here: counts measured from individual market turning points, and anniversaries of major historical events. Then I look for overlap.
One Pair At A Time
A count starts from an identified turning point. For the confirmed swings used here, that means a high or low that held through a retest. The count measures forward from that starting point to another date worth watching.
GBP/USD’s table uses calendar-day counts. The degree-based time counts use a 360-degree year: a full rotation represents one year. Those degrees describe time, not a percentage change in price.
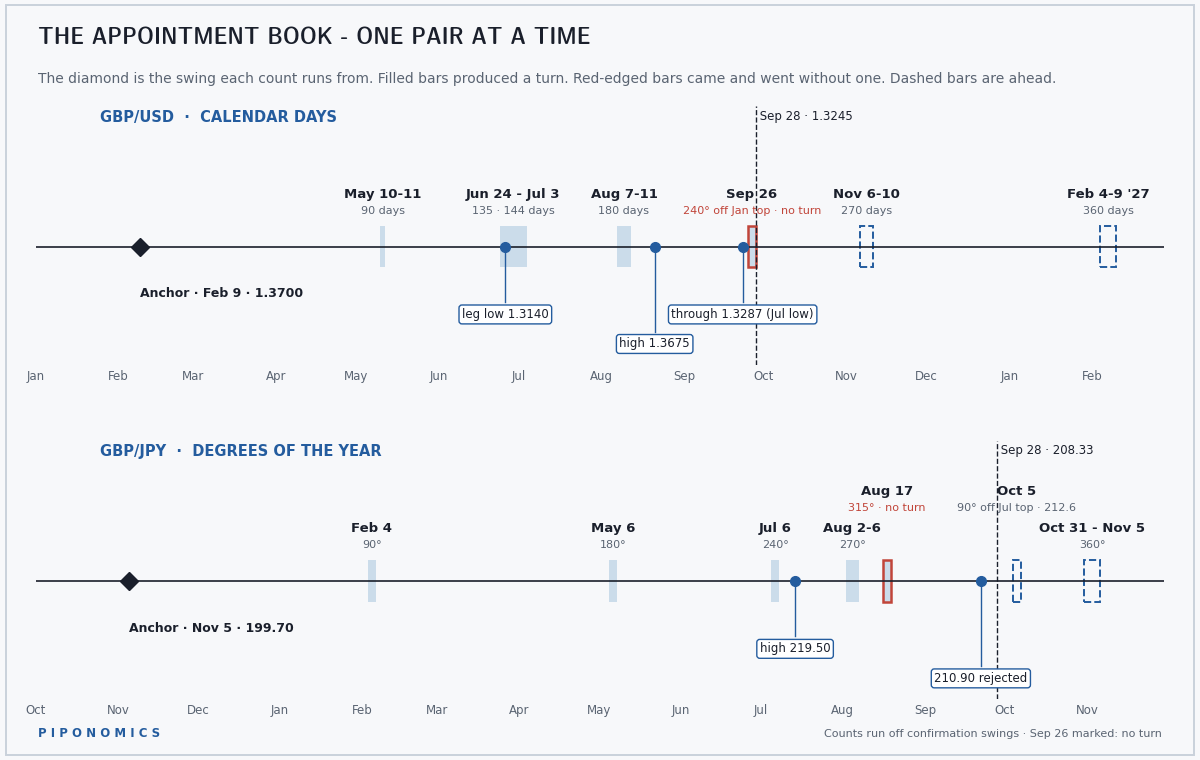
GBP/USD’s September 26 date passed without a turn. More important, price broke 1.3287, the July low discussed alongside the earlier 180-day cycle analysis. An actual support break matters more than a new date arriving without a reaction. The timing call missed. The bearish price signal did not. My read remains that the decline from 1.3675 has more work to do.
GBP/JPY’s next date-and-price test is October 5 at 212.6. Friday’s close at 208.33 was 427 pips below that level. To reach it, price would first need to recover through resistance at 210.3-210.7. I am not treating the approaching date as a reason to assume that recovery will happen.
USD/JPY’s new counts start from the July 23 high at 163.98. The 60-degree time mark fell on September 22. The bounce high arrived September 24. Those dates were close. The next listed USD/JPY timing window is the 90-degree count on October 21-22. For or GBP/USD, the next listed window is the 270-day count on November 6-10. For GBP/JPY, the full-year count falls on October 31-November 5.
Scar Tissue - The Historical Calendar
This calendar tracks anniversaries of 135 all-time records across 27 pairs. The gap records begin January 1, 1993. I flag square-number anniversaries, multiples of seven, and decades. Those are the "master years" in this method. Three flagged anniversaries within 15 days create a watch window.
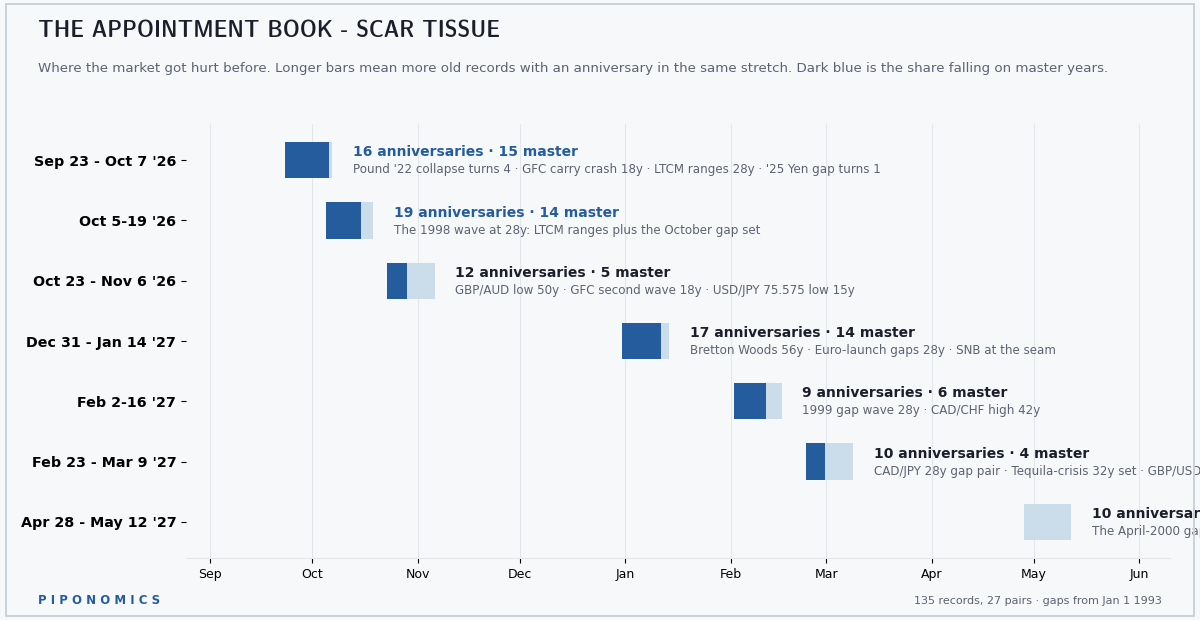
Saturday, September 26, was the fourth anniversary of the pound’s 2022 collapse to 1.0350. Four qualifies under the square-number rule.
GBP/USD did not turn on the anniversary. It had already broken its July low three days earlier.
Next up is October 7-8, the 28th anniversary of the 1998 USD/JPY collapse. The pair fell from the 130s to the 110s in two sessions as the carry trade unwound.
Twenty-eight is four sevens, so the event qualifies under the seven-year rule. It also falls inside the current watch period, with professional yen positioning balanced and the yen crosses approaching their monthly decision point.
Where The Two Calendars Overlap
The current-swing calendar uses 36 committed starting dates. I compare those counts with the historical anniversaries to identify overlapping watch periods. An overlap gets more attention. It does not become a signal by itself. The corridor is the combined September 23-October 19 watch period. It contains two overlapping windows: September 23-October 7 and October 5-19.
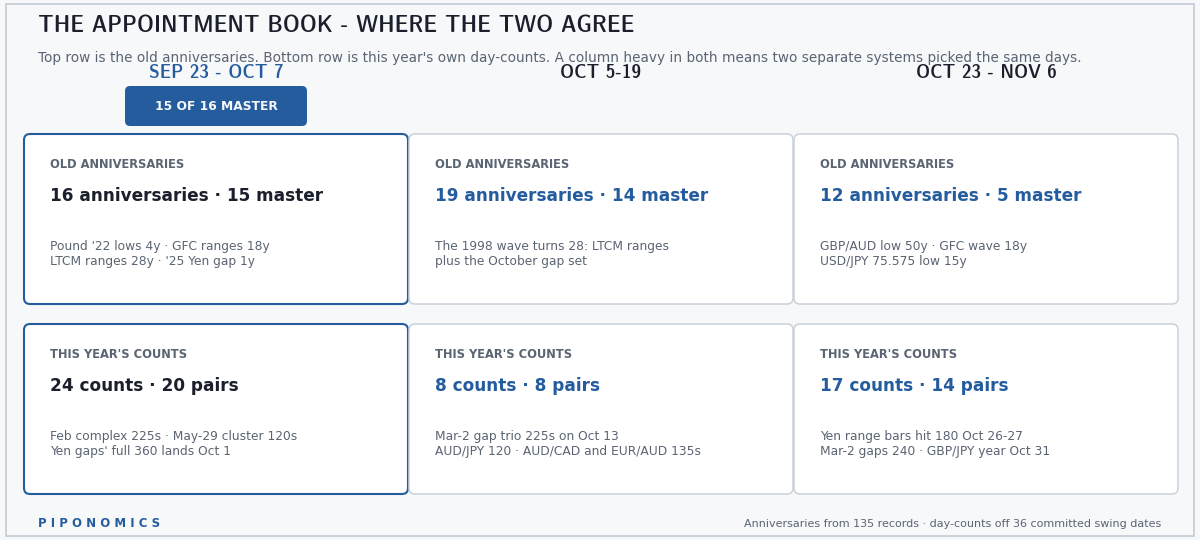
First window: September 23-October 7. It contains 16 historical anniversaries and 24 current-swing day counts. The first three sessions brought five notable moves. None met a listed date-and-price test, so none gets added to the Ledger as a calendar hit.
Second window: October 5-19. It has more historical anniversaries, 19, but fewer current-swing counts, eight. That makes it a different mix of inputs, not automatically a stronger signal. The 1998 USD/JPY anniversary sits inside it. Before that second window starts, Wednesday’s monthly close will decide whether the GBP/JPY and EUR/JPY downside conditions have actually been met.
04 PRICE AND TIME
What this shows: Gann-derived price levels and their associated dates, checked against price behavior.
The Square of Nine, plus the Hexagon chart on yen pairs, generates reference levels from selected major highs and lows.
A quarter-rotation means 90 degrees around the wheel. A half-rotation means 180 degrees. Those labels identify the calculation used to produce a level. They do not mean the currency is expected to fall by a quarter or half.
The useful question is what happens when price reaches the result. Does it hold? Reject? Break through? Does the test coincide with a listed timing date?
The Running Record
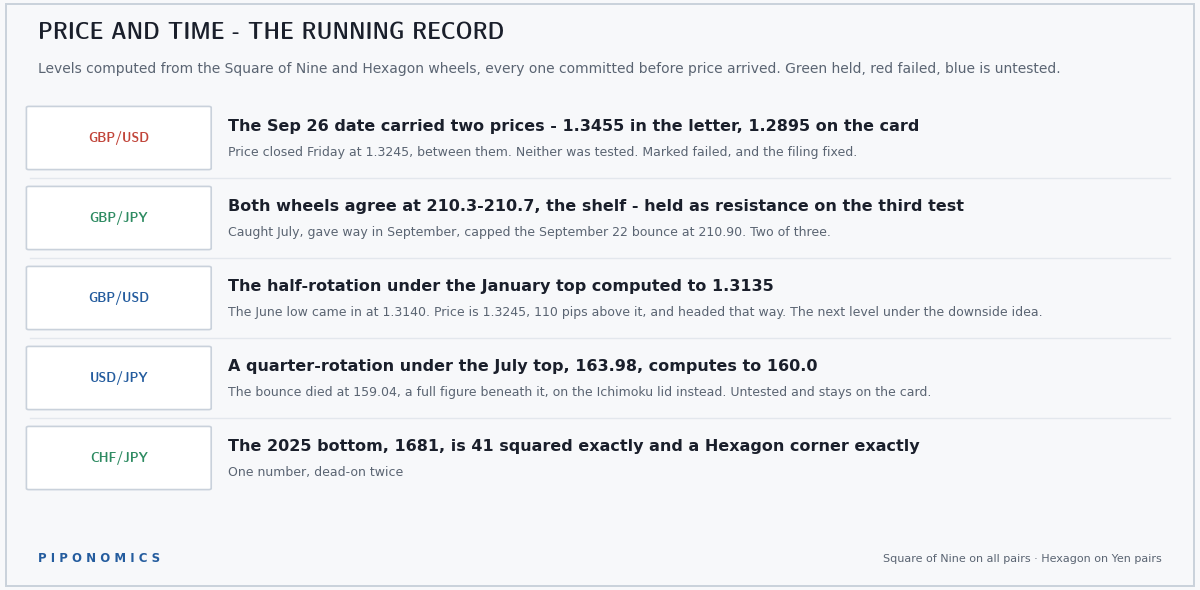
GBP/USD’s September 26 pairing at 1.3455 failed. The date arrived without a test of the price level.
The next price level below is 1.3135, calculated from the January top using a half-rotation. June’s low was 1.3140, just five pips away.
That is the important overlap: a calculated level sitting beside an actual prior low. The support area is 105-110 pips below Friday’s 1.3245 close.
GBP/JPY’s 210.3-210.7 shelf remains relevant. July’s decline stopped there. September broke through it. Tuesday’s rebound then failed to close back above it.
Former support is now acting as resistance. Two of the three tracked tests respected the zone.
USD/JPY’s quarter-rotation below 163.98 produces 160.0. Last week’s rebound stopped at 159.04 instead, near the lower Ichimoku resistance area.
The 160.0 Gann level was not tested. It stays on the chart. It does not get credit for a rejection somewhere else.
Dates And Corresponding Price Levels
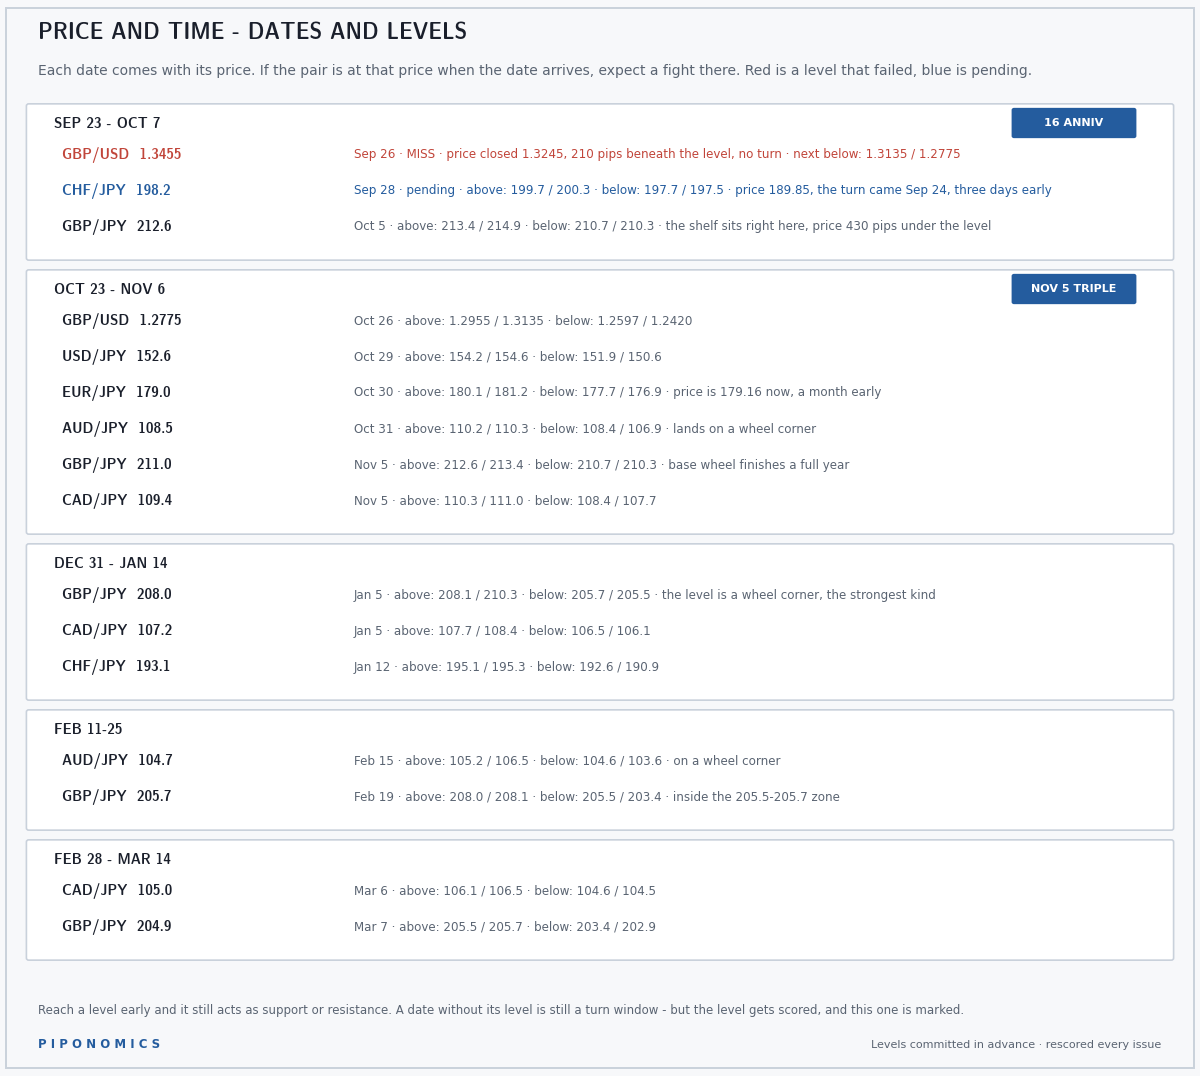
September 28: CHF/JPY / 198.2. Friday’s close was 189.85. The price level remains untested; the possible early turn remains under review.
October 5: GBP/JPY / 212.6. The level is 427 pips above Friday’s close, with nearer resistance at 210.3-210.7.
October 30: EUR/JPY / 179.0. Price is already near the level at 179.16, roughly a month early.
Being near the price now does not validate the October 30 timing call. Price and time are separate observations until the conditions for the combined test are met.
05 MONEY WHERE THE MOUTH IS
What this shows: Which ideas are active, which are waiting for confirmation, and what would invalidate them.
The monthly bars are not finished. A condition forming during the month is not the same as a confirmed monthly close.
USD/JPY - Upside Idea Closed
Status: Nullified at resistance.
Next review: Wednesday, September 30.
Levels still on the chart: 160.0 above; 156.0 below.
Original wrong-if: 153.24. This belonged to the retired idea.
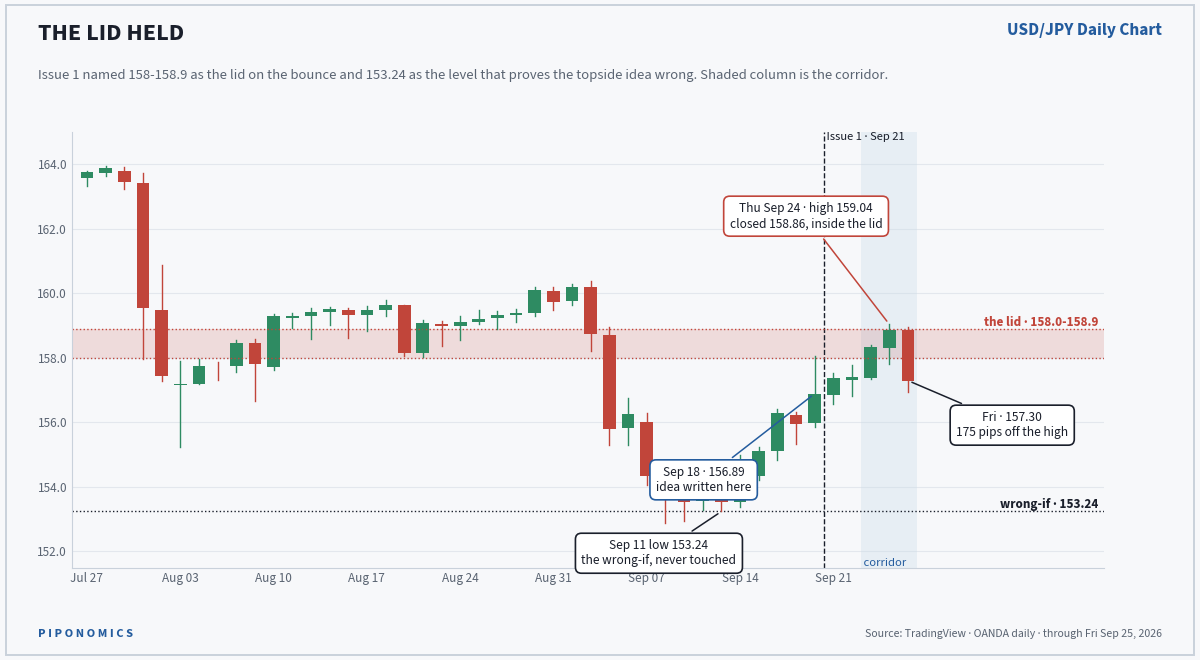
Thursday’s high was 159.04. The close at 158.86 was back inside the resistance band. Friday finished at 157.30, 174 pips below Thursday’s high.
The daily Ichimoku setup helps explain why that area mattered. The Chikou Span, faced several obstacles in the same region: prior candle bodies, the Tenkan-Sen, and the lower edge of the Cloud. Different parts of the chart pointed to resistance in roughly the same place.
The earlier net-long yen bias was gone. That weakens the positioning argument behind the USD/JPY squeeze idea; it does not mean every yen long disappeared.
Nothing new until Wednesday’s monthly close. The Gann level at 160.0 remains overhead. The half-rotation at 156.0 remains below. If the yen-cross bearish signals confirm, the next USD/JPY idea I consider will not be another upside squeeze.
GBP/USD - Downside Idea Remains Active
Friday’s close: 1.3245.
Next support area: 1.3135-1.3140.
Wrong if: A weekly close back above 1.3400.
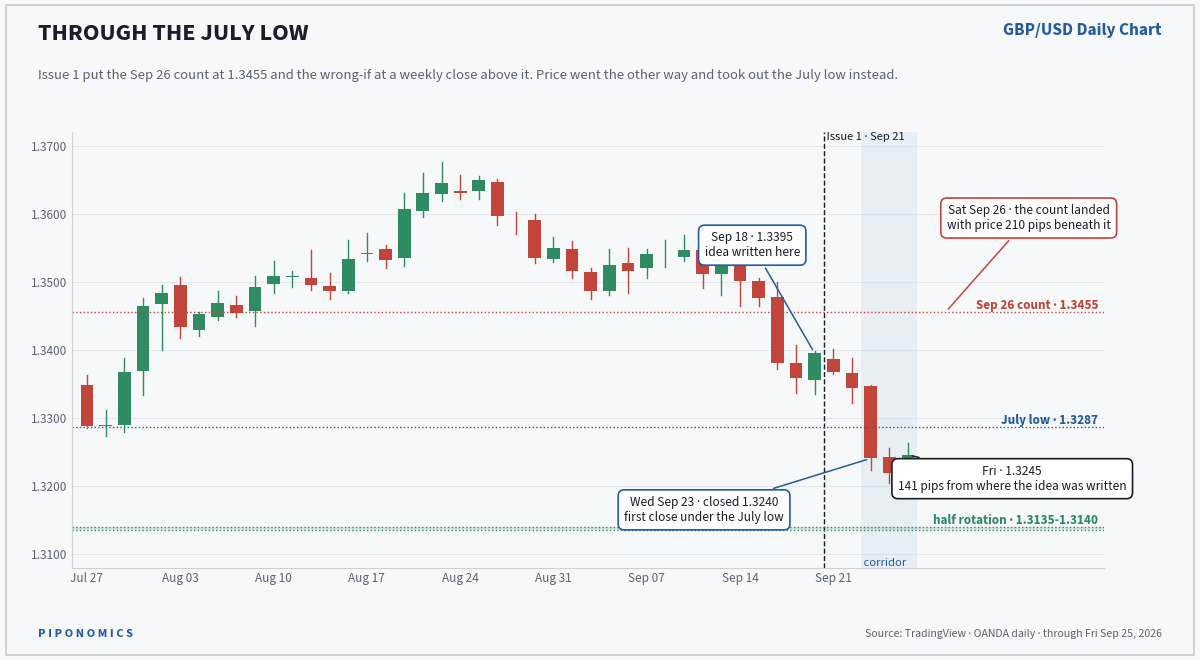
GBP/USD broke its July low on Wednesday and reached 1.3204 on Thursday. Friday’s close was 142 pips below Monday’s 1.3387 opening reference.
The September 22 positioning report also showed 6,742 additional professional pound shorts. The next support area combines the Gann level at 1.3135 with June’s low at 1.3140. That leaves 105-110 pips between Friday’s close and the area I am watching. The caution is how much ground the pair has already covered. It has fallen 430 pips from the August 21 high at 1.3675 in five weeks.
This is a move to follow, not chase.
The next listed 270-day timing window is November 6-10. That is a date to watch, not a promise that the decline continues uninterrupted until then. The invalidation level moves down from last week’s weekly close above 1.3455 to a weekly close above 1.3400. The wrong-if moves down. It does not move to breakeven. Breakeven is a feeling and not a level.
EUR/USD - Downside Idea Active From Monday
Friday’s close: 1.1391.
Possible support area: Near 1.105.
Wrong if: A weekly close back above 1.1482.
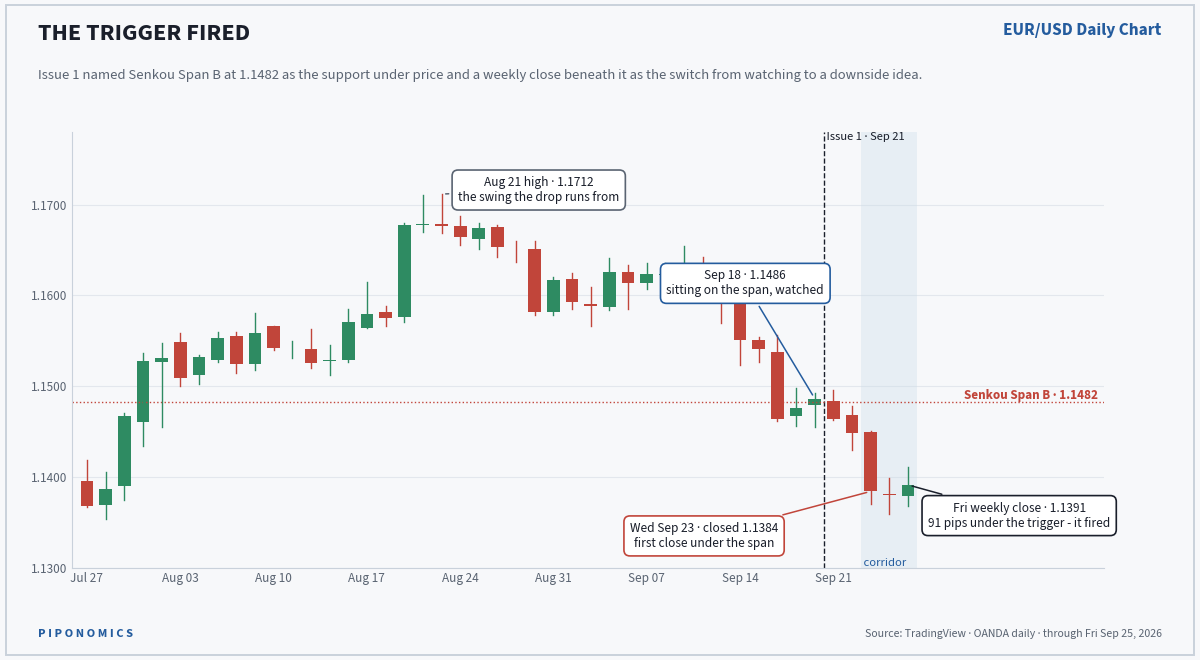
EUR/USD closed below its weekly Ichimoku Cloud for the first time since March 2025.
The broken boundary is 1.1482, the Senkou Span B level in this setup. Wednesday’s daily close at 1.1384 was the first break. Friday’s weekly close at 1.1391 confirmed it. Momentum supports the bearish reading. The Composite Index produced the bearish signal I was watching, and the Detrended Price Oscillator crossed below zero.
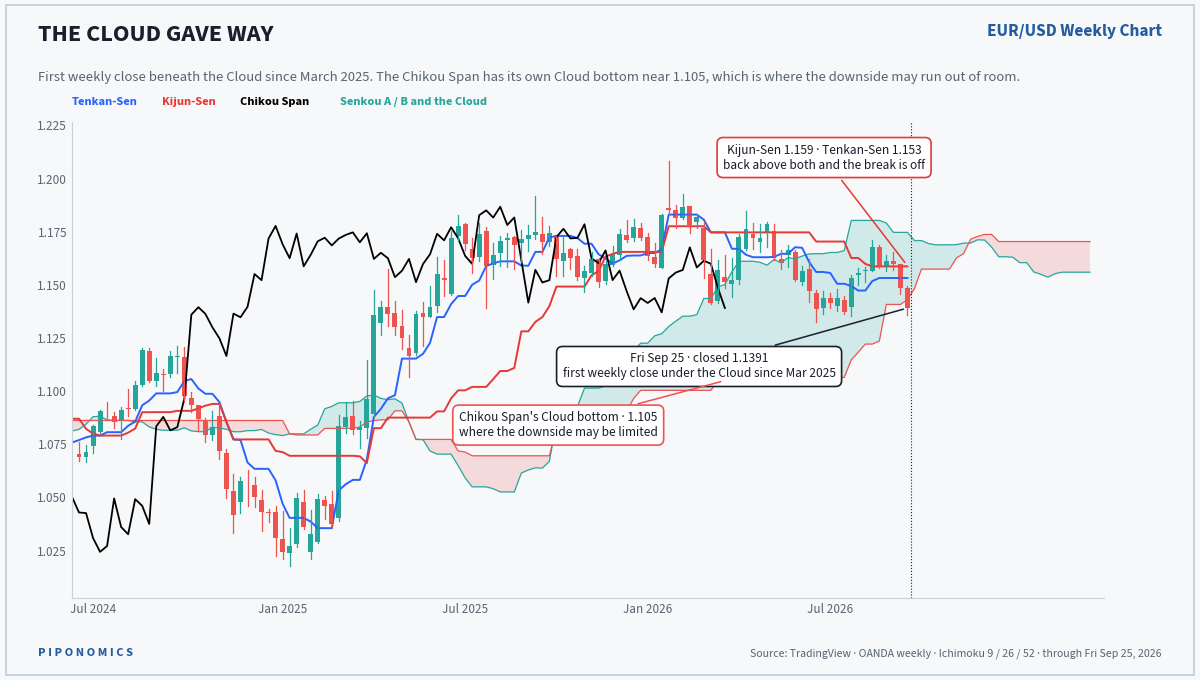
The rest of my Ichimoku checklist agrees. Price is below the Cloud and below the Tenkan-Sen and Kijun-Sen, the other two chart lines used in this assessment.
Clean breakdown. Not unlimited room.
The catch is near 1.105, where the Chikou Span’s interaction with the Cloud identifies possible support. That is roughly 340 pips below Friday’s close. It is an area where the decline could run into trouble, not a guaranteed destination.
Two other things keep this a cautious idea.
First, professional euro positioning is 55% short, but funds added both longs and shorts. That is mixed positioning activity, not a clean one-way build I am counting as extra bearish confirmation.
Second, the idea becomes active after Friday’s close was already 91 pips below the original trigger. Arriving at the party after the good chips are gone.
A weekly close back above 1.1482 invalidates the idea. Back inside the Cloud, and the breakdown no longer meets the condition I am trading.
GBP/JPY - Waiting On September’s Close
Reference price: 208.33.
Trigger: September’s monthly DPO closes below zero, with 210.3-210.7 still holding as resistance.
If confirmed: Downside idea begins Thursday, October 1.
Next monthly Ichimoku support: 199.9.
Wrong if: A subsequent weekly close is back above 210.7.
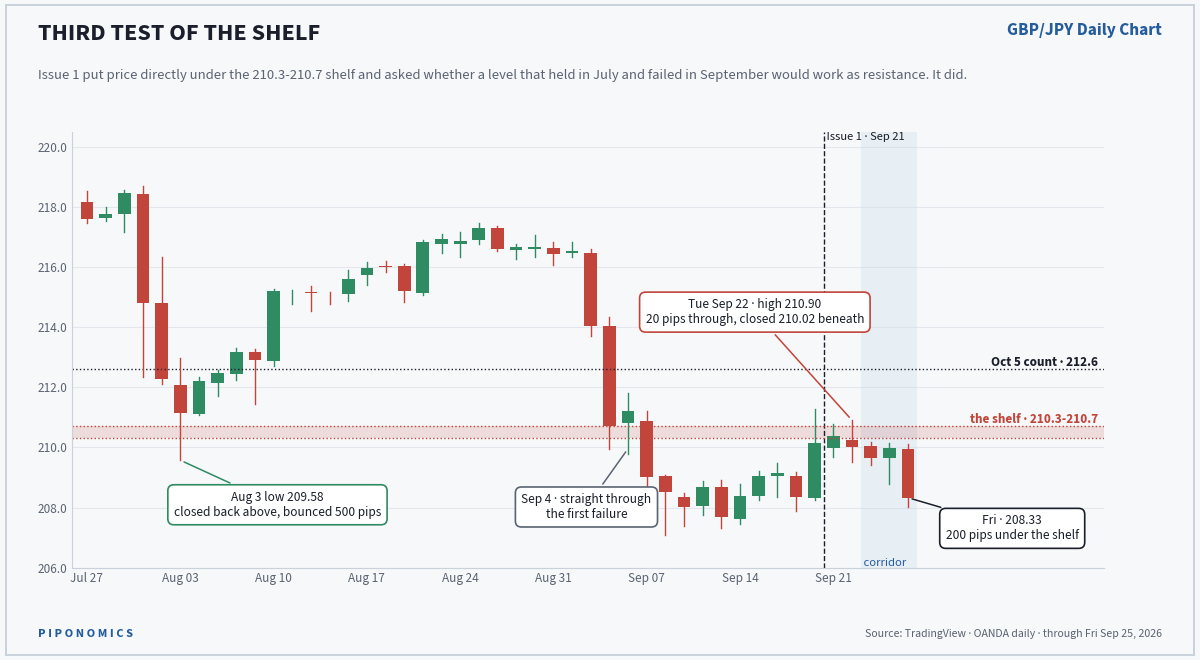
Tuesday’s high reached 210.90. The close was back below the shelf. Price finished the week at 208.33.
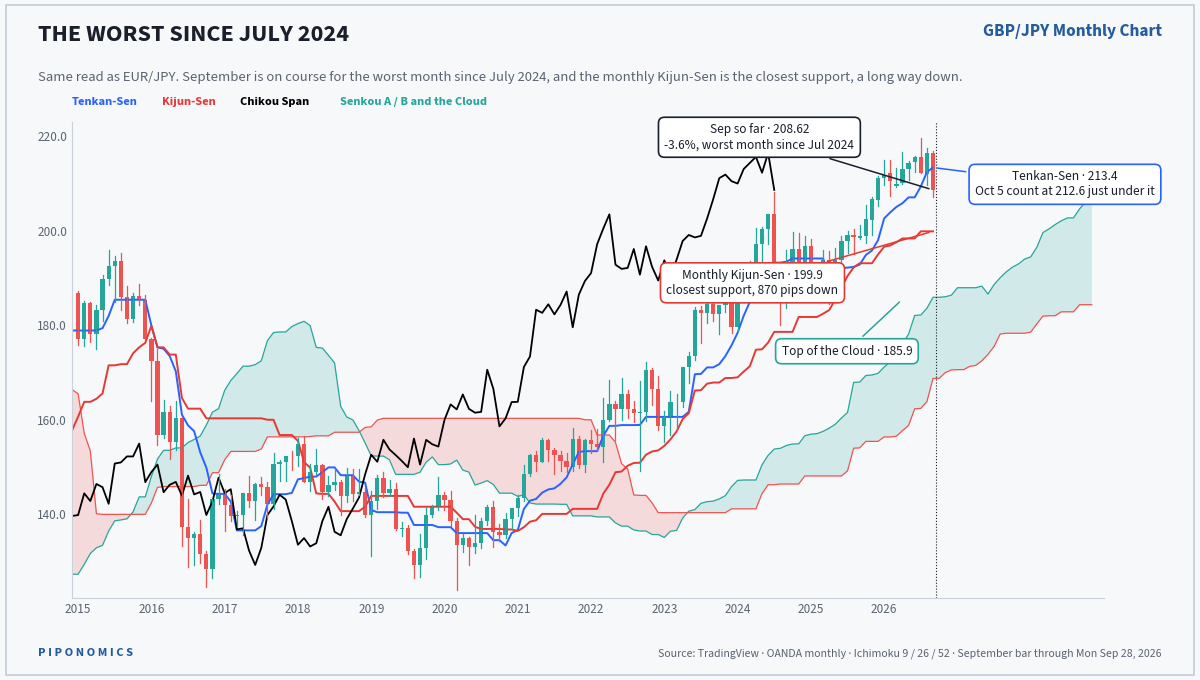
GBP/JPY is down 3.7% on the month in this snapshot. If September ended here, it would be the worst month since July 2024. The monthly DPO is moving below zero. In this setup, I treat a completed monthly close below zero as a warning that the decline could become a larger move.
Wednesday decides whether that signal completes.
The Composite Index needs a separate explanation. It is approaching a level on the indicator that has mattered since 2018. With the monthly DPO threatening a bearish close, I am also watching the deeper Composite Index zones associated with 2008 and 2016.
Those are oscillator levels. They are not GBP/JPY price targets. On the price chart, the next monthly Ichimoku support is the Kijun-Sen at 199.9, 843 pips below 208.33. This particular monthly setup shows no intervening Ichimoku support. That does not erase every possible level on another chart or timeframe.
If September closes with the DPO below zero and the shelf remains resistance, the downside idea becomes active at Thursday’s open. Nearby resistance stays at 210.3-210.7. Higher up, the October 5 Gann level at 212.6 sits near the monthly Tenkan-Sen at 213.4. The calendar does not overrule the monthly closing condition.
EUR/JPY - Same Monthly Decision
Reference price: 179.16.
Trigger: September’s monthly DPO closes below zero.
If confirmed: Downside idea begins Thursday, October 1.
Next monthly Ichimoku support: 171.2.
Wrong if: A subsequent weekly close is back above 181.6, the September 18 high.
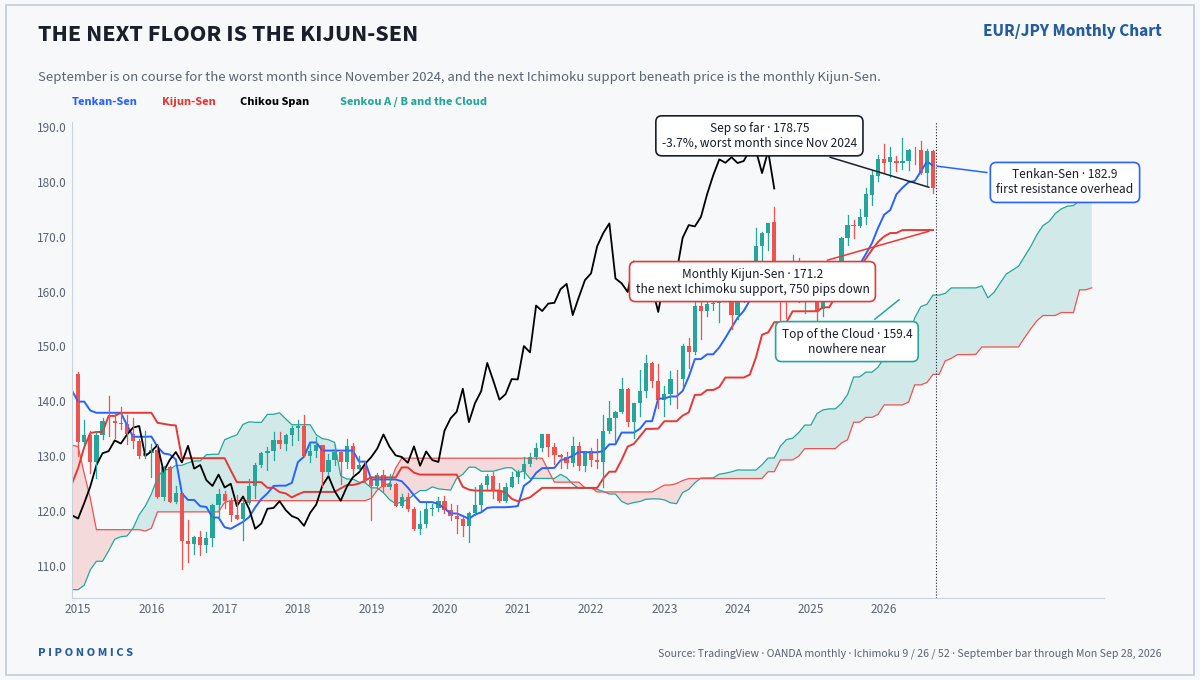
EUR/JPY is down 3.5% on the month. If September closed here, it would be the worst month since November 2024. The monthly DPO is developing the same bearish signal as GBP/JPY. It is further along, but the month still has to close.
The Composite Index is approaching a historical support zone on the indicator. That deserves attention. It is not enough for me to call a bottom while the monthly DPO is threatening to confirm below zero. On the price chart, the next monthly Ichimoku support is the Kijun-Sen at 171.2, 796 pips below Friday’s close. The monthly Tenkan-Sen sits overhead at 182.9.
EUR/JPY is also already near its 179.0 Gann level. The associated timing date is October 30, roughly a month away. The current price interaction does not validate that future date.
This remains my first candidate if both yen-cross setups confirm Wednesday. The condition that activates the idea is still the monthly DPO close, not the approaching calendar date. If it confirms, the downside idea starts Thursday. A subsequent weekly close above 181.6 invalidates it.
AUD/USD - Still Waiting
Reference price: 0.7024.
Condition for a downside idea: A weekly close below 0.7000.
AUD/USD fell 146 pips in a week. The Big Guys reduced their longs by 5,898 contracts, yet their remaining position was still 75% long.
Waiting was the right call.
The next question is whether the decline develops into a downside setup or simply punishes people who arrive late to the first break. My stated condition is a weekly close below 0.7000.
NZD/JPY - No Setup
Reference price: 89.10.
Price remains inside the weekly Ichimoku Cloud rather than breaking out of it.
Still stay away. Still not politely.
06 THE WEEK AHEAD
What this shows: This week’s decision points, followed by the remaining dates inside the September 23-October 19 watch period.
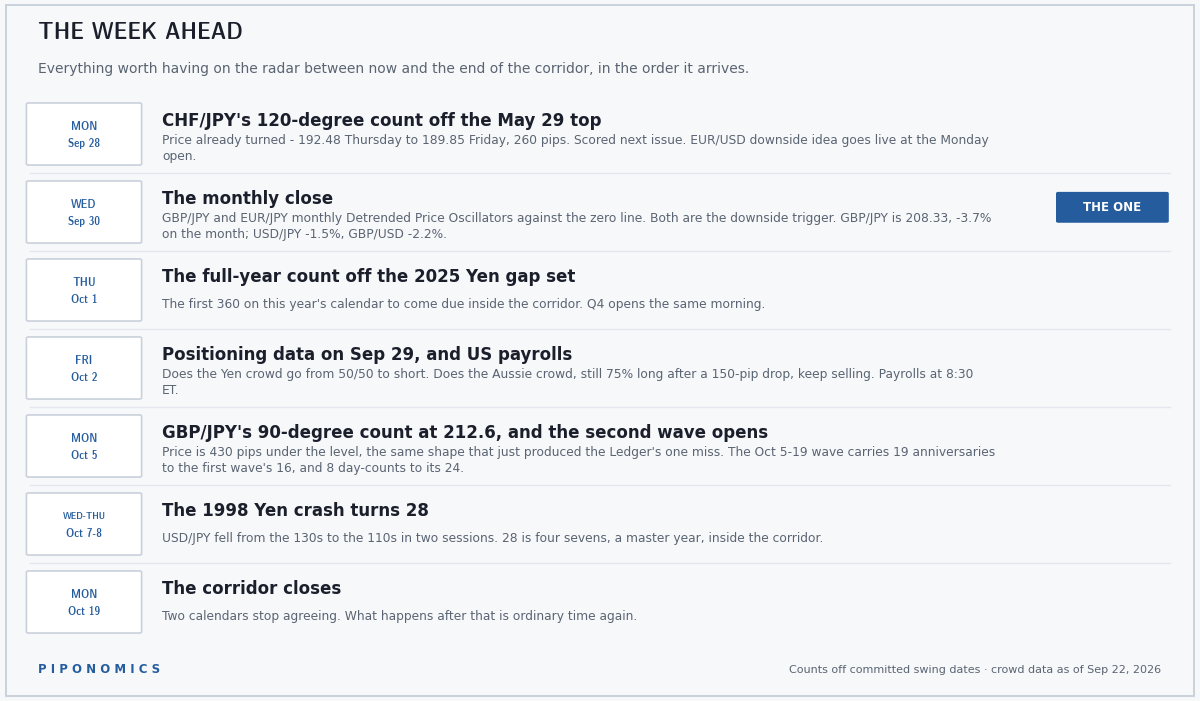
Monday, September 28. CHF/JPY’s timing date arrives with the corresponding 198.2 price level still untested. The possible early turn remains under review. EUR/USD’s downside idea becomes active at the open.
Wednesday, September 30. The monthly close. This is the one the issue is waiting on. GBP/JPY and EUR/JPY need their monthly DPO readings to finish below zero. GBP/JPY also needs the 210.3-210.7 shelf to remain resistance.
Thursday, October 1. The yen-cross downside ideas become active only if Wednesday confirms their conditions. The calendar also marks a full-year count from the 2025 yen-gap starting points. Here, the 360-degree time count means one year.
Friday, October 2. The next positioning report reflects positions as of Tuesday, September 29. The questions: Did professional yen positioning move from balanced toward a net-short bias? Did the Aussie crowd keep reducing longs into a falling market?
Monday, October 5. GBP/JPY’s next date-and-price test: October 5 / 212.6. The second watch window opens. More historical anniversaries than the first window, fewer current-swing counts.
Wednesday-Thursday, October 7-8. The 1998 USD/JPY collapse turns 28. It qualifies under the calendar’s seven-year rule. By then, the yen-cross monthly conditions will either have confirmed or failed. The anniversary does not get to change the result.
Monday, October 19. The current watch period ends.
Terms & Conditions 📝
Securities Disclaimer: STOCKTWITS IS NOT A TAX ADVISOR, BROKER, FINANCIAL ADVISOR OR INVESTMENT ADVISOR. THE SERVICE IS NOT INTENDED TO PROVIDE TAX, LEGAL, FINANCIAL OR INVESTMENT ADVICE, AND NOTHING ON THE SERVICE SHOULD BE CONSTRUED AS AN OFFER TO SELL, A SOLICITATION OF AN OFFER TO BUY, OR A RECOMMENDATION FOR ANY SECURITY. Trading in such securities can result in immediate and substantial losses of the capital invested. You should only invest risk capital, and not capital required for other purposes. You alone are solely responsible for determining whether any investment, security or strategy, or any other product or service, is appropriate or suitable for you based on your investment objectives and personal and financial situation. You should also consult an attorney or tax professional regarding your specific legal or tax situation. The Content is to be used for informational and entertainment purposes only and the Service does not provide investment advice for any individual. Stocktwits, its affiliates and partners specifically disclaim any and all liability or loss arising out of any action taken in reliance on Content, including but not limited to market value or other loss on the sale or purchase of any company, property, product, service, security, instrument, or any other matter. You understand that an investment in any security is subject to a number of risks, and that discussions of any security published on the Service will not contain a list or description of relevant risk factors. In addition, please note that some of the stocks about which Content is published on the Service have a low market capitalization and/or insufficient public float. Such stocks are subject to more risk than stocks of larger companies, including greater volatility, lower liquidity and less publicly available information. Read the full terms & conditions here. 🔍